
Week 7: Distributed Log Analytics — “Turn raw logs into decisions”
What we’re building today
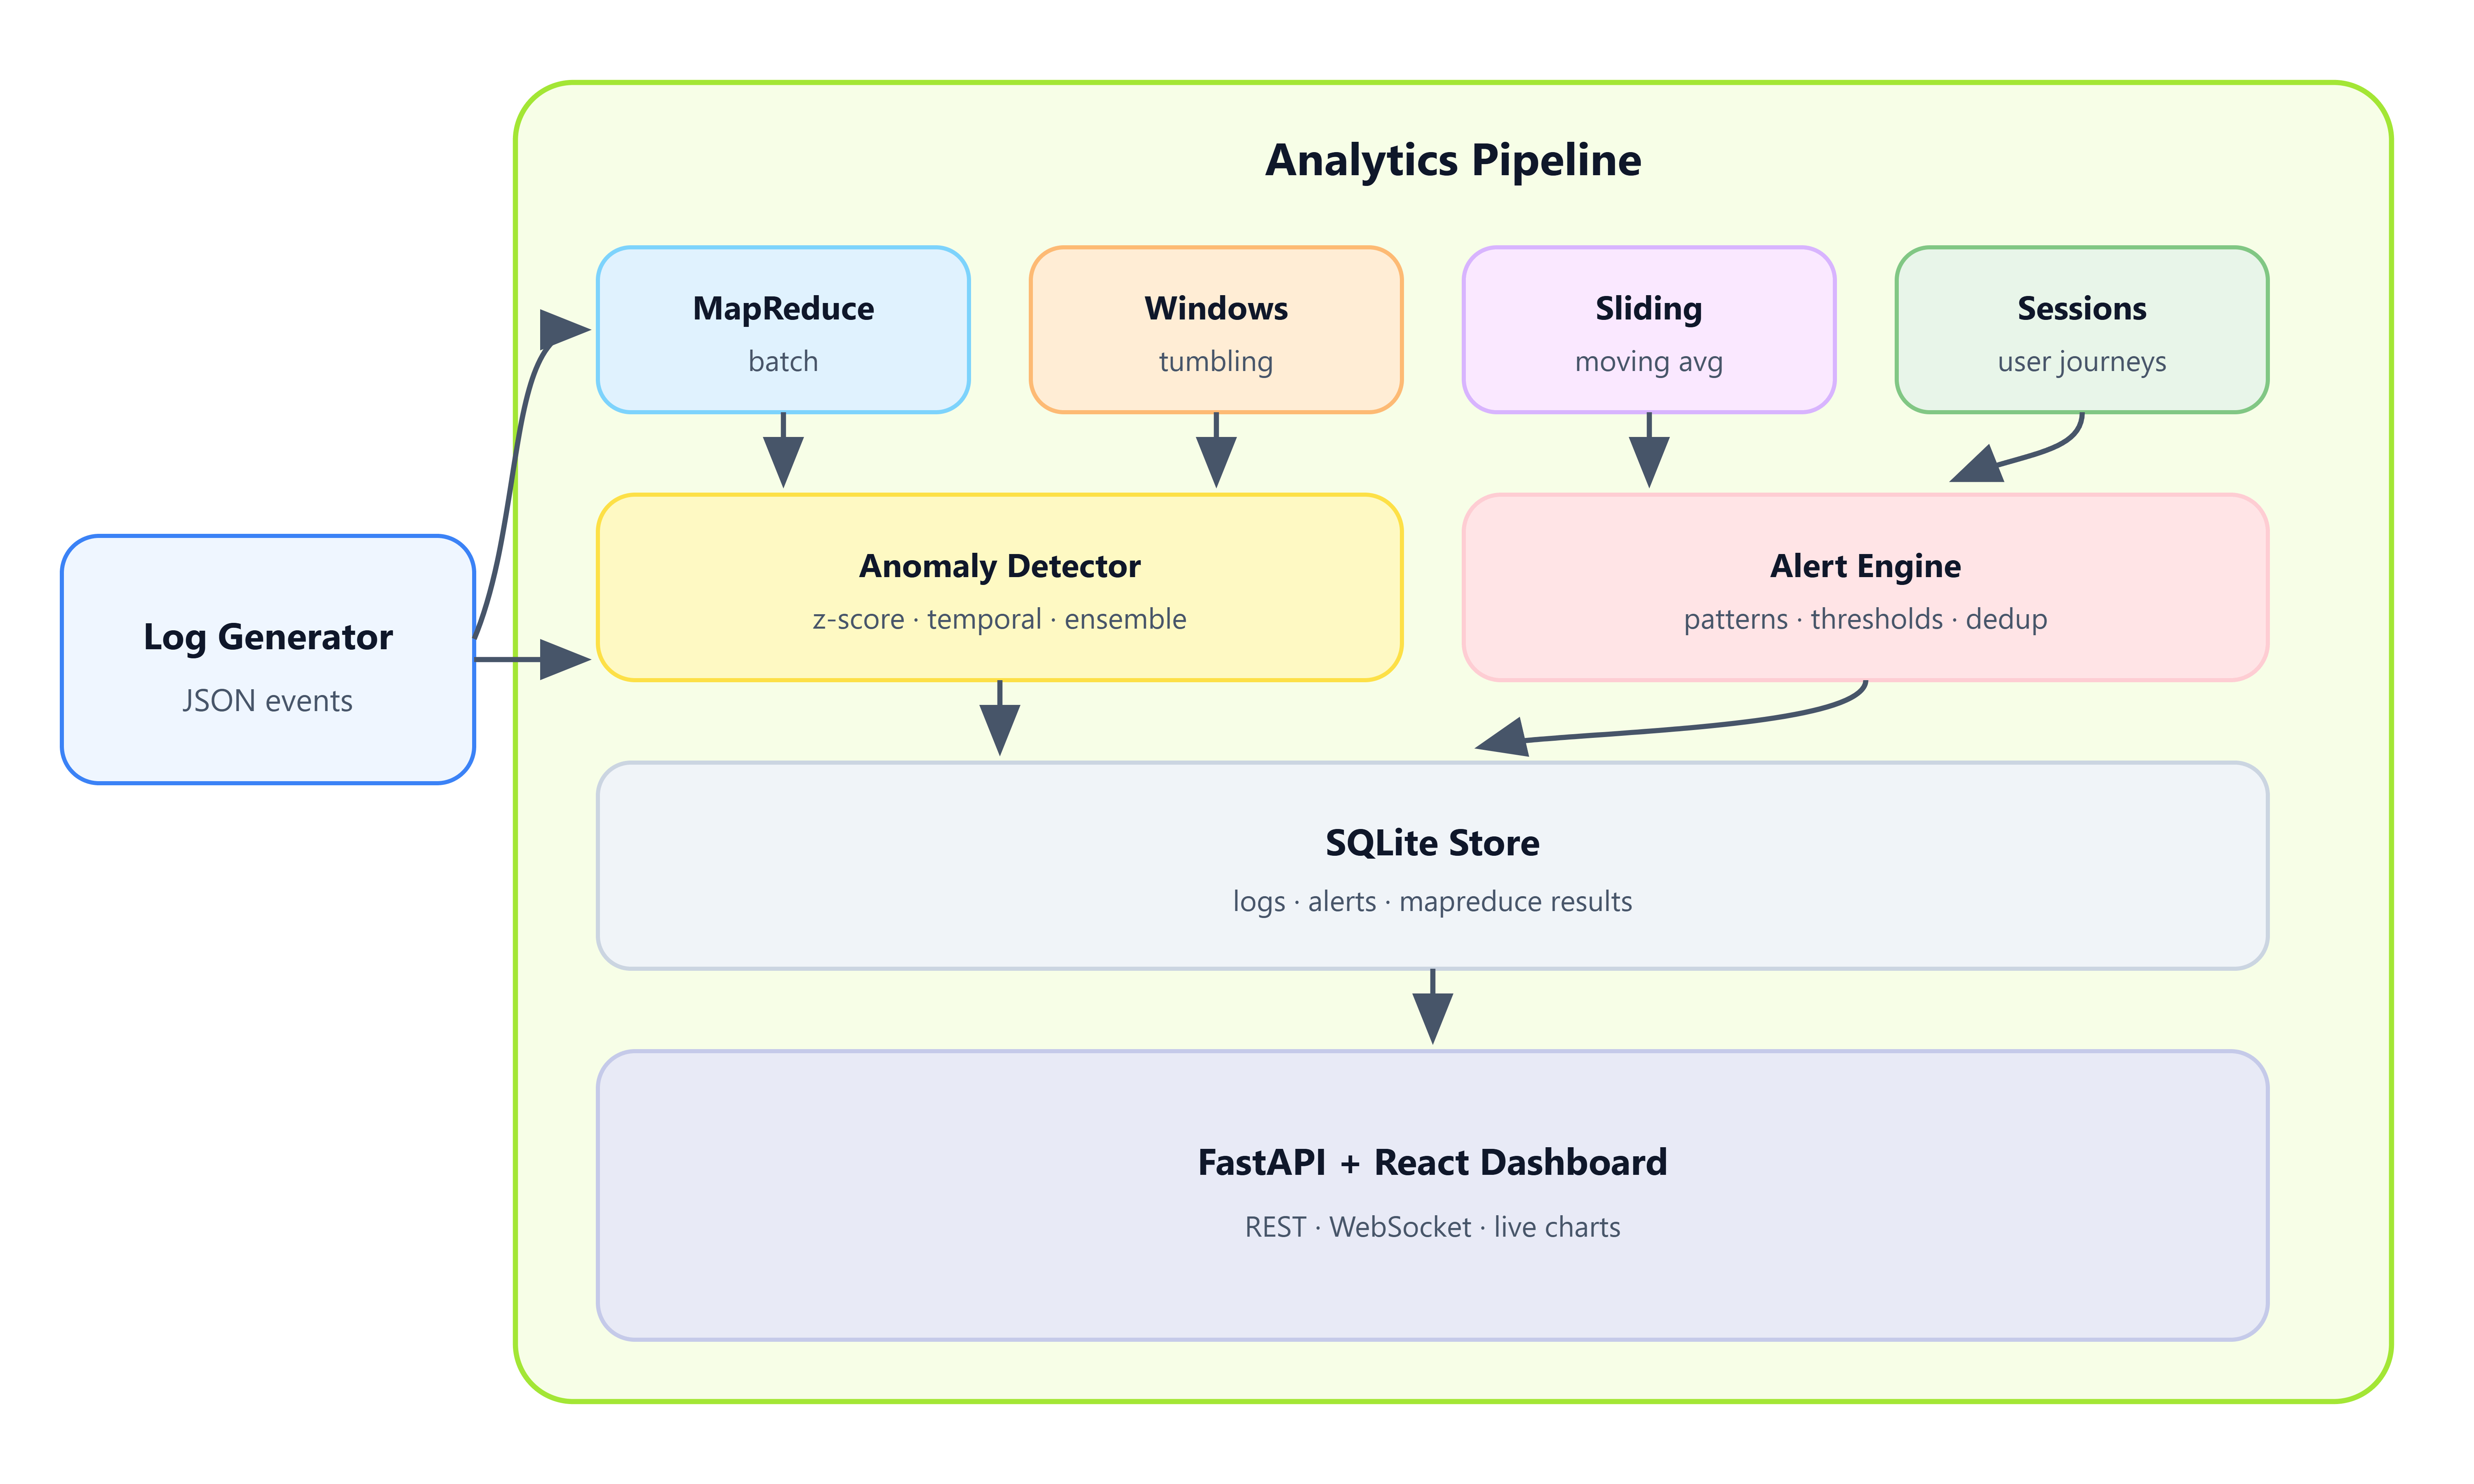
Shopify processes billions of checkout events. Datadog turns them into error spikes you see in seconds—not after a nightly batch job. This week you wire seven analytics layers into one pipeline: batch MapReduce, tumbling windows, sliding averages, user sessions, anomaly scoring, alert rules, and a live React dashboard.
By the end you’ll have:
MapReduce word-count and pattern-frequency jobs on real log batches
60-second tumbling windows with error-rate aggregation
30-second sliding windows for response-time trends
Session tracking with engagement scoring
Three-method anomaly ensemble (z-score, temporal, isolation heuristic)
Threshold-based alerts with deduplication
A WebSocket dashboard showing all metrics live
Why this matters
Google’s MapReduce paper (2004) made petabyte log analysis possible—Hadoop and Spark descend directly from it.
Flink and Kafka Streams use windowing primitives almost identical to what you build on Day 46–47.
Stripe sessionizes checkout flows to detect fraud rings; your sessionizer uses the same timeout-and-group pattern.
Cloudflare anomaly detection on request logs prevents DDoS false negatives—ensemble voting beats any single detector.
Batch answers “what happened yesterday?” Streaming windows answer “what’s happening now?” Alerts close the loop.
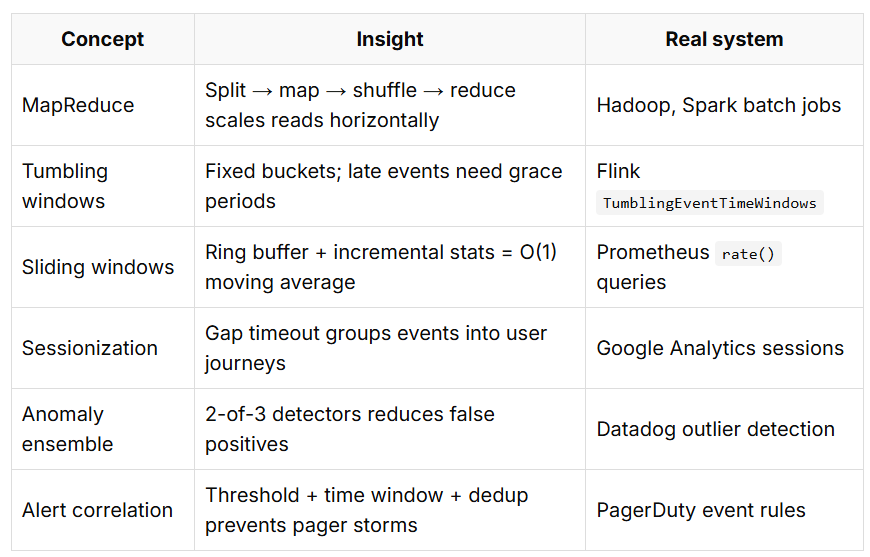
Core concepts
Architecture
Preparing for a distributed systems interview?
→Download the free Interview Pack
→ Subscribe now to access source code repository - 200 + coding lessons
