Week 2 : Network-Based Log Collection: From TCP Ingestion to Throughput Measurement
1. Introduction
Most production systems do not keep logs on the machine that generated them. Applications emit events continuously; operators need those events centralized, searchable, and durable. That requirement pushes you toward network-based log collection: agents and receivers that accept log streams over TCP or UDP, buffer them when downstream systems lag, batch and compress them to save bandwidth, encrypt them in transit, and finally land them in storage or a message bus like Kafka.
This integrated Week 2 project (
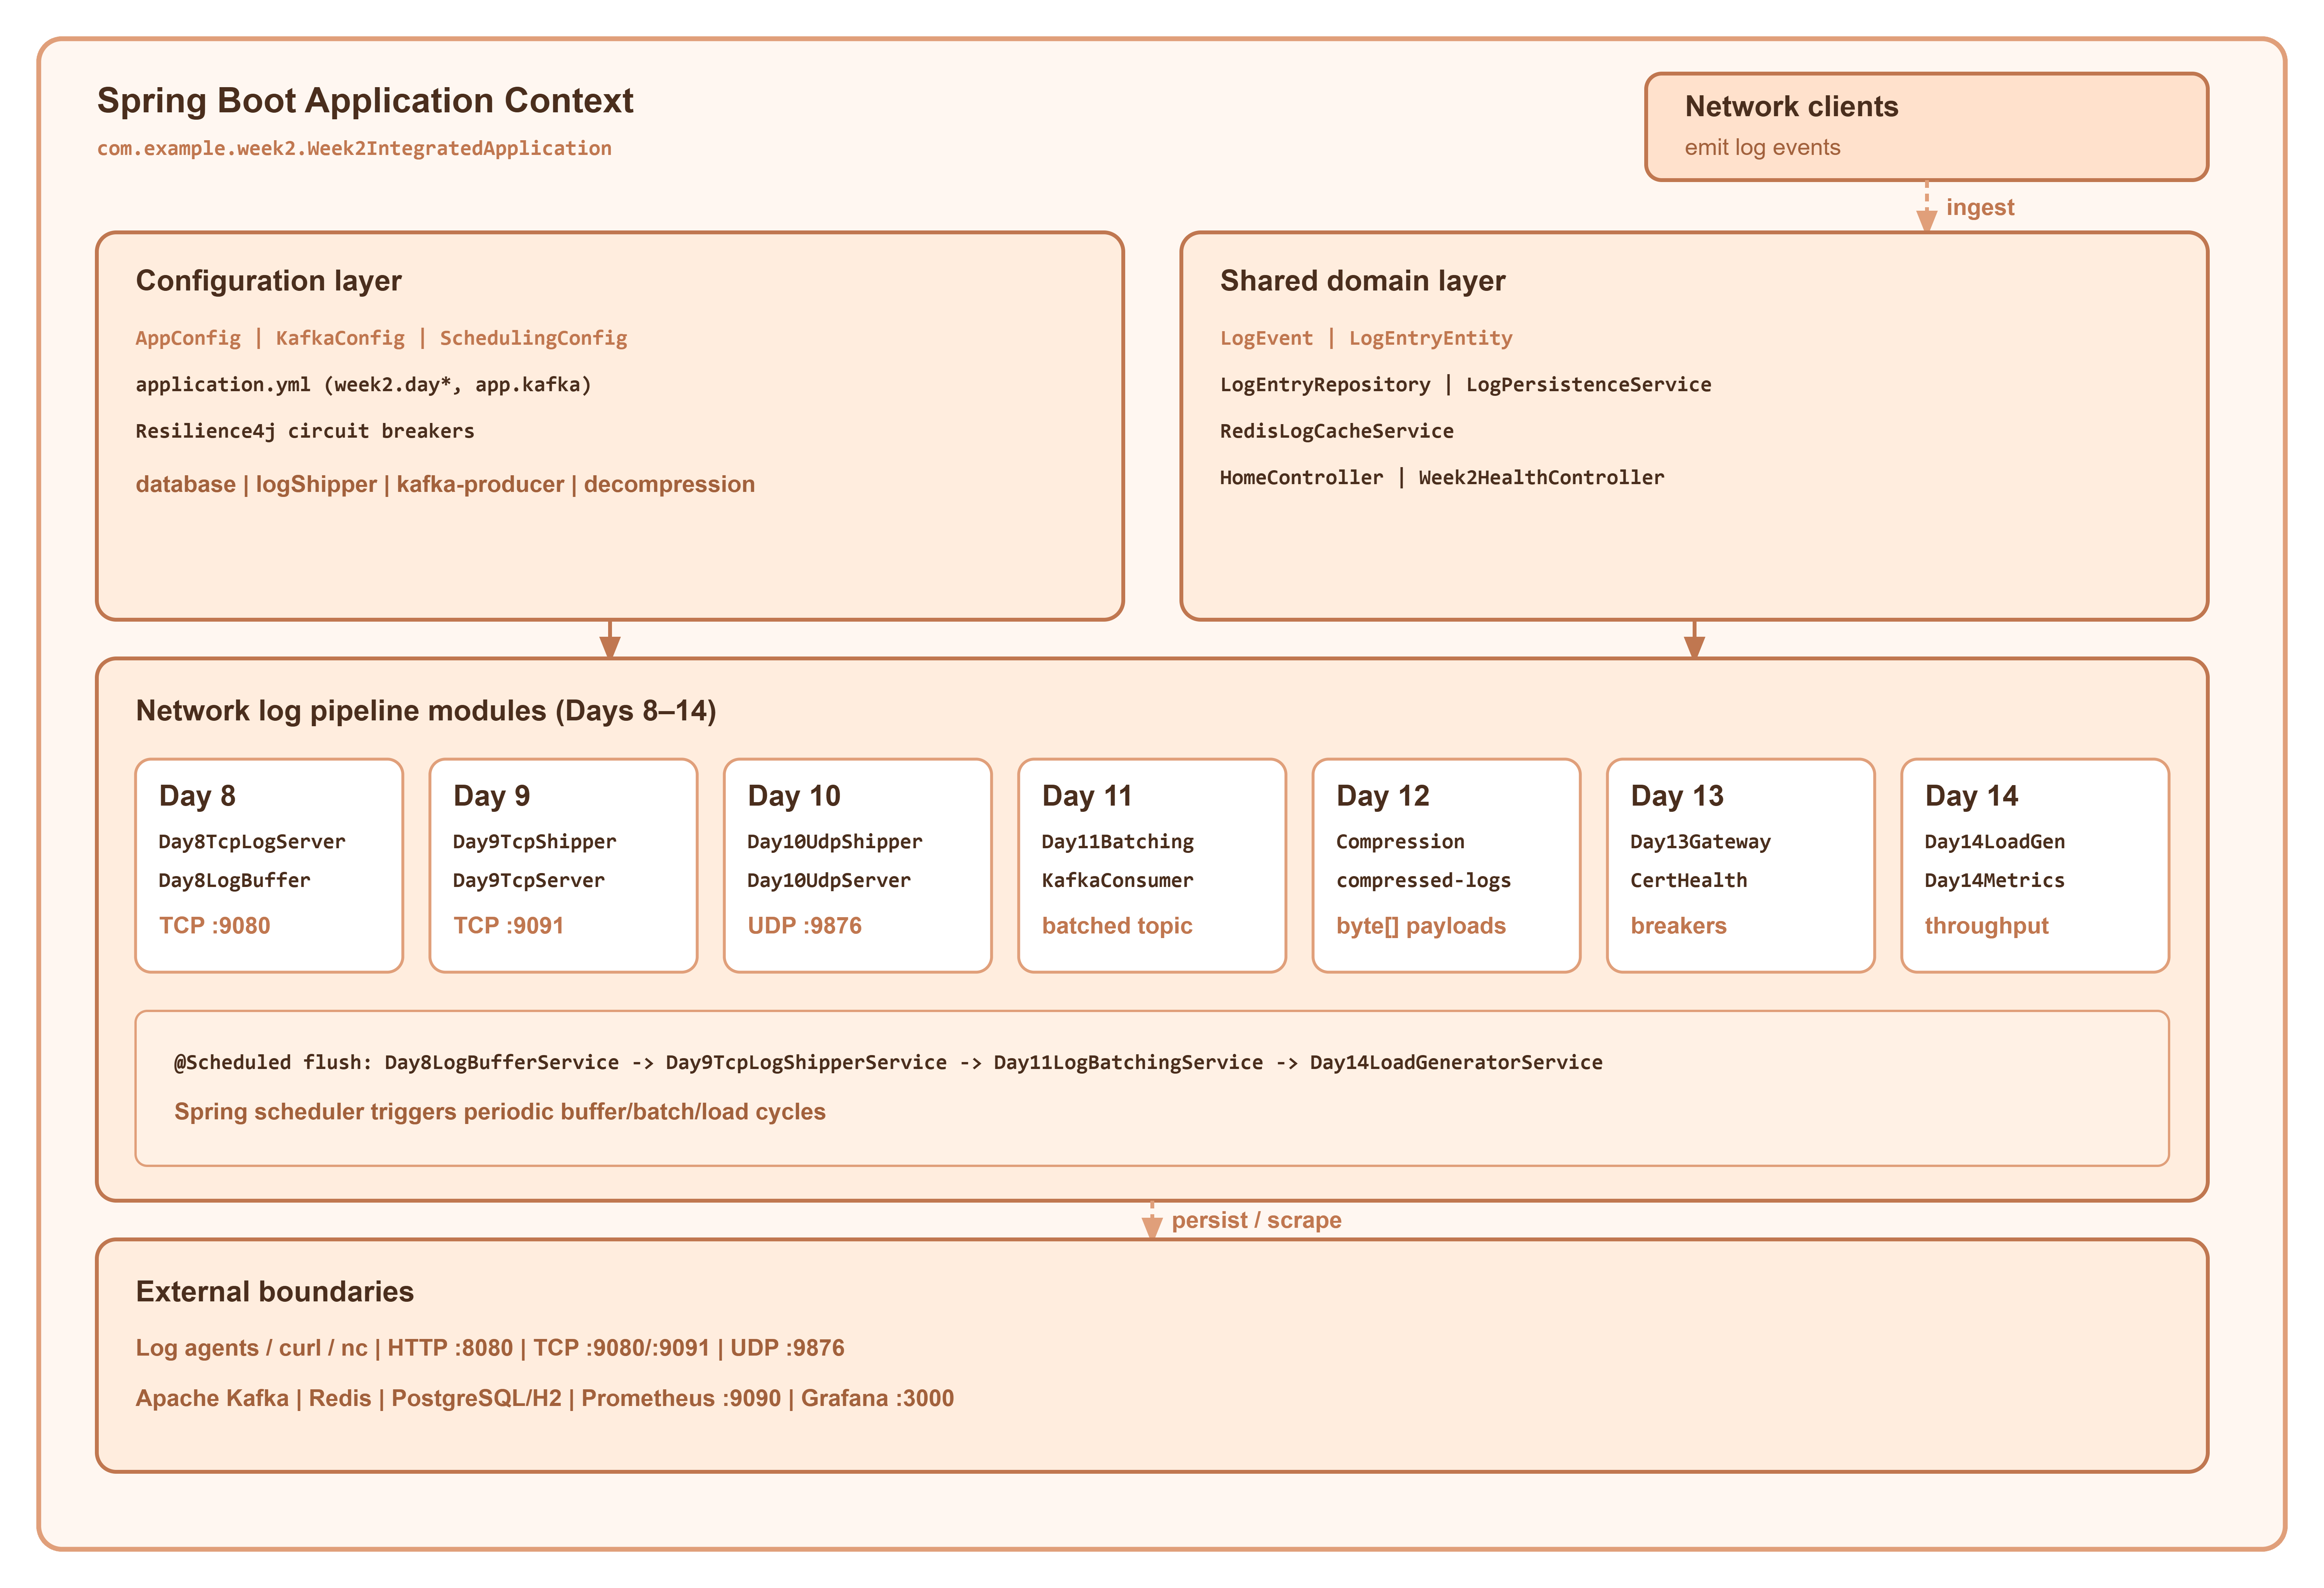
week_2_integrated_project) walks that arc in seven incremental layers—Days 8 through 14—inside a single Spring Boot application (com.example.week2.Week2IntegratedApplication). Each day remains a distinct package (com.example.week2.day8…day14), while shared persistence, configuration, and observability live undercom.example.week2.common. You can run the full stack locally on one JVM (HTTP on 8080, Day 8 Netty TCP on 9080, Day 9 TCP receiver on 9091, Day 10 UDP on 9876) and optionally attach Prometheus and Grafana for dashboards.This article is written for a mid-level engineer who knows Spring Boot and wants to treat log shipping as an infrastructure problem, not a one-off socket demo. You will see how transport choice, buffering, batching, compression, TLS readiness, and load testing interact—and how to keep each concern in a module that can be understood and tested on its own.
2. From Fundamentals to a Unified System
Day 8 — TCP Server and Bounded In-Memory Buffering
Day 8 implements a Netty-based TCP log server (Day8TcpLogServer) that listens on port 9080 (configured via week2.day8.tcp.port in application.yml). Incoming lines are framed as newline-delimited JSON and handled by Day8LogMessageHandler, which validates timestamp, level, and message before handing events to Day8LogBufferService. The buffer is a bounded LinkedBlockingQueue; when it fills, events are dropped and counted in Day8LogMetrics.
The engineering concern is backpressure at the edge: a naive server that writes synchronously to a database will collapse under burst traffic. Day 8 decouples network I/O from persistence with a scheduled flush (@Scheduled(fixedDelay = 5000)) and batch writes through LogPersistenceService, guarded by a Resilience4j circuit breaker named database. REST queries are exposed at /api/week2/day8/logs/* via Day8LogQueryController.
Day 9 — Log Shipping Client and Kafka Handoff
Day 9 adds a TCP shipping pipeline: HTTP clients post to Day9LogIngestionController (POST /api/week2/day9/logs), Day9TcpLogShipperService buffers JSON lines and flushes them every 100ms to Day9TcpServerService on port 9091, and the receiver publishes each line to the Kafka topic logs (Day9KafkaLogConsumer persists via LogPersistenceService and caches ERROR logs in Redis through RedisLogCacheService).
The concern is reliable forwarding across process boundaries. The shipper uses a circuit breaker (logShipper) and reconnect logic; when app.kafka.enabled is false (default local profile), logs are stored directly so the API remains testable without Kafka.
Day 10 — UDP for High-Throughput, Loss-Tolerant Paths
Day 10 introduces UDP transport via Day10UdpLogShipperService and Day10UdpServerService (port 9876). Datagrams carry an 8-byte sequence number prefix plus JSON payload. The shipper tracks in-flight messages, retries on timeout, and exposes POST /api/week2/day10/logs/ship. The UDP server uses a NIO Selector loop and forwards to Kafka topic logs.udp.ingress; Day10KafkaConsumerService deduplicates and persists.
The concern is throughput versus delivery guarantees: UDP avoids connection overhead but requires application-level sequencing and dedupe—patterns you see in statsd-style agents and some observability collectors.
Day 11 — Batching to Optimize Network and Broker Usage
Day 11 centralizes batching in Day11LogBatchingService: events land in an ArrayBlockingQueue, flush when the batch reaches week2.day11.batching.max-batch-size (1000) or on a time trigger (@Scheduled every 5000ms). A single Kafka message carries a JSON array on topic log-events-batched. Day11KafkaConsumerService deserializes the array and calls saveAllFromEvents. Optional synthetic traffic comes from Day11LogGeneratorService when week2.day11.generator.enabled=true.
The concern is amortizing fixed costs—fewer TCP segments, fewer Kafka produce requests, better broker compression ratios—at the cost of latency until the batch fills or the timer fires.
Day 12 — Application-Level Compression
Day 12 compresses payloads before Kafka in Day12CompressionService (NONE, GZIP, SNAPPY, LZ4) with algorithm selection based on payload size. Day12KafkaProducerService attaches Kafka headers compression-algorithm and original-size; Day12KafkaConsumerService decompresses inside a Resilience4j decompression circuit breaker. Ingest is via POST /api/week2/day12/logs (Day12LogController).
The concern is bandwidth and broker load when JSON log lines are repetitive or large. Note that broker-level compression (compression.type) and application-level compression solve different problems; this project demonstrates the latter explicitly.
Day 13 — TLS Readiness and Production Resilience
Day 13 hardens the Kafka produce path with Day13KafkaProducerService (@CircuitBreaker(name = "kafka-producer")) and Day13GatewayController (@CircuitBreaker(name = "producer-service")) on POST /api/week2/day13/logs. Day13CertificateHealthIndicator (bean name day13CertificateHealth) reports Actuator health based on JKS certificate expiry when week2.day13.ssl.keystore-path is set; locally it reports UP with certificateCheck: skipped. WARN/ERROR logs are cached in Redis in Day13KafkaConsumerService.
The concern is secure, observable pipelines: encryption in transit (TLS scaffolding), failure isolation (circuit breakers), and operator visibility (health indicators)—without conflating “TLS configured” with “TLS required in dev.”
Day 14 — Load Generation and Throughput Measurement
Day 14 adds sustained and burst load through Day14LoadGeneratorService (@Scheduled steady rate when week2.day14.load-generator.enabled=true) and POST /api/week2/day14/load/burst. Day14KafkaProducerService records Micrometer timers; Day14KafkaConsumerService runs with concurrency 3 and publishes day14.log.processing.time percentiles. Operators inspect throughput via Day14MetricsController (/api/week2/day14/metrics/summary) and Grafana panels fed from /actuator/prometheus.
The concern is capacity planning: you cannot claim a pipeline handles 10k logs/sec without a generator, metrics, and a dashboard that prove it under your hardware and configuration.
3. Architecture Overview
At runtime, the system is one Spring Boot process whose context is rooted at Week2IntegratedApplication with @EnableScheduling and @EnableAsync for periodic flushes and load generation.
Configuration layer (com.example.week2.common.config):
AppConfig—ObjectMapper,CircuitBreakerRegistry,RestTemplate,WebClient.BuilderKafkaConfig— conditional onapp.kafka.enabled; providesKafkaTemplate<String, String>and byte-array templates for Day 12SchedulingConfig— enables Spring’s scheduler for@Scheduledmethods across day modulesapplication.yml— ports, topics, batch sizes, and profile-specific datasource (H2 forlocal, PostgreSQL fordocker)
Shared domain layer (com.example.week2.common):
LogEvent— canonical DTOLogEntryEntity/LogEntryRepository— JPA persistence withmodulecolumn distinguishing day pipelinesLogPersistenceService— single write path for map, event, and batch insertsRedisLogCacheService— optional dedupe and error cachingHomeController/Week2HealthController— discovery and aggregate health
Per-day transport and pipeline modules sit beside common code: Netty (day8), blocking TCP + Kafka (day9), UDP + Kafka (day10), batching (day11), compression (day12), resilient gateway (day13), load + metrics (day14).
External boundaries:
Log producers (curl,
nc, agents) on HTTP 8080 and network ports 9080/9091/9876Kafka cluster (when enabled) on
spring.kafka.bootstrap-serversRedis (optional) for cache and dedupe
Prometheus/Grafana (Docker Compose) scraping
/actuator/prometheuson the host