Day 99: Building a Health Monitoring System for Distributed Log Platform
Week 14: Web Interface and Dashboards | Module 4: Building a Complete Distributed Log Platform

What We're Building Today
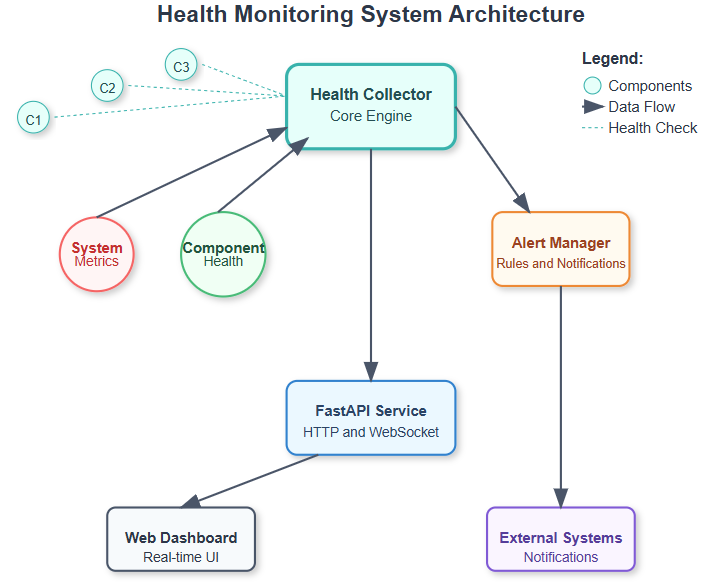
Today we're constructing the central nervous system of your distributed log platform - a comprehensive health monitoring system that continuously tracks component status, performance metrics, and system vitals. Think of it as the medical monitoring equipment in a hospital ICU, but for your distributed infrastructure.
Core Components We'll Implement:
Real-time health status tracking for all platform components
Performance metrics collection and aggregation
Resource utilization monitoring (CPU, memory, disk, network)
Service availability checks with automated alerting
Interactive dashboard for health visualization
Historical trend analysis and anomaly detection
System Context: The Platform's Vital Signs Monitor
Your distributed log platform now spans multiple components: log collectors, message queues, processing engines, storage systems, and web interfaces. Without centralized health monitoring, identifying bottlenecks or failures becomes reactive firefighting rather than proactive management.
Real-World Context: Netflix's monitoring infrastructure processes over 1 trillion metrics daily across their distributed systems. Their platform health monitoring prevents cascading failures that could impact millions of users. Similarly, your health monitoring system prevents minor issues from becoming platform-wide outages.