
Day 71: Profile and Optimize the Log Ingestion Pipeline
What We’re Building Today
JVM profiling harness using async-profiler + JFR to find CPU/memory hotspots in the ingestion path
Batching and compression tuning across the Kafka producer, consumer, and HTTP ingest layer
Thread-pool right-sizing with measured queue saturation and latency percentiles
Before/after benchmark dashboard — Prometheus metrics exposed so the improvement is quantifiable, not anecdotal
Why This Matters
Every distributed log pipeline eventually hits a performance wall. The wall isn’t random — it’s almost always the same three culprits: serialization overhead eating CPU, undersized thread pools causing artificial queuing, and naïve per-event I/O that could be batched. Netflix’s Vector team traced 40 % of their ingestion CPU to Jackson serialization before switching to a binary codec. Uber’s M3 pipeline saw 3× throughput gains purely from Kafka producer batch tuning without touching business logic.
The insight that separates senior engineers from mid-level ones: you don’t optimize what you guess — you optimize what the profiler proves. Premature optimization is a maintenance tax with no guaranteed dividend. Today we instrument first, measure under realistic load, identify the actual bottleneck, and then apply a targeted fix. Then we measure again. That loop — profile → hypothesis → change → validate — is the discipline that makes improvements stick.
System Design Deep Dive
1. The Ingestion Pipeline as a Series of Queues
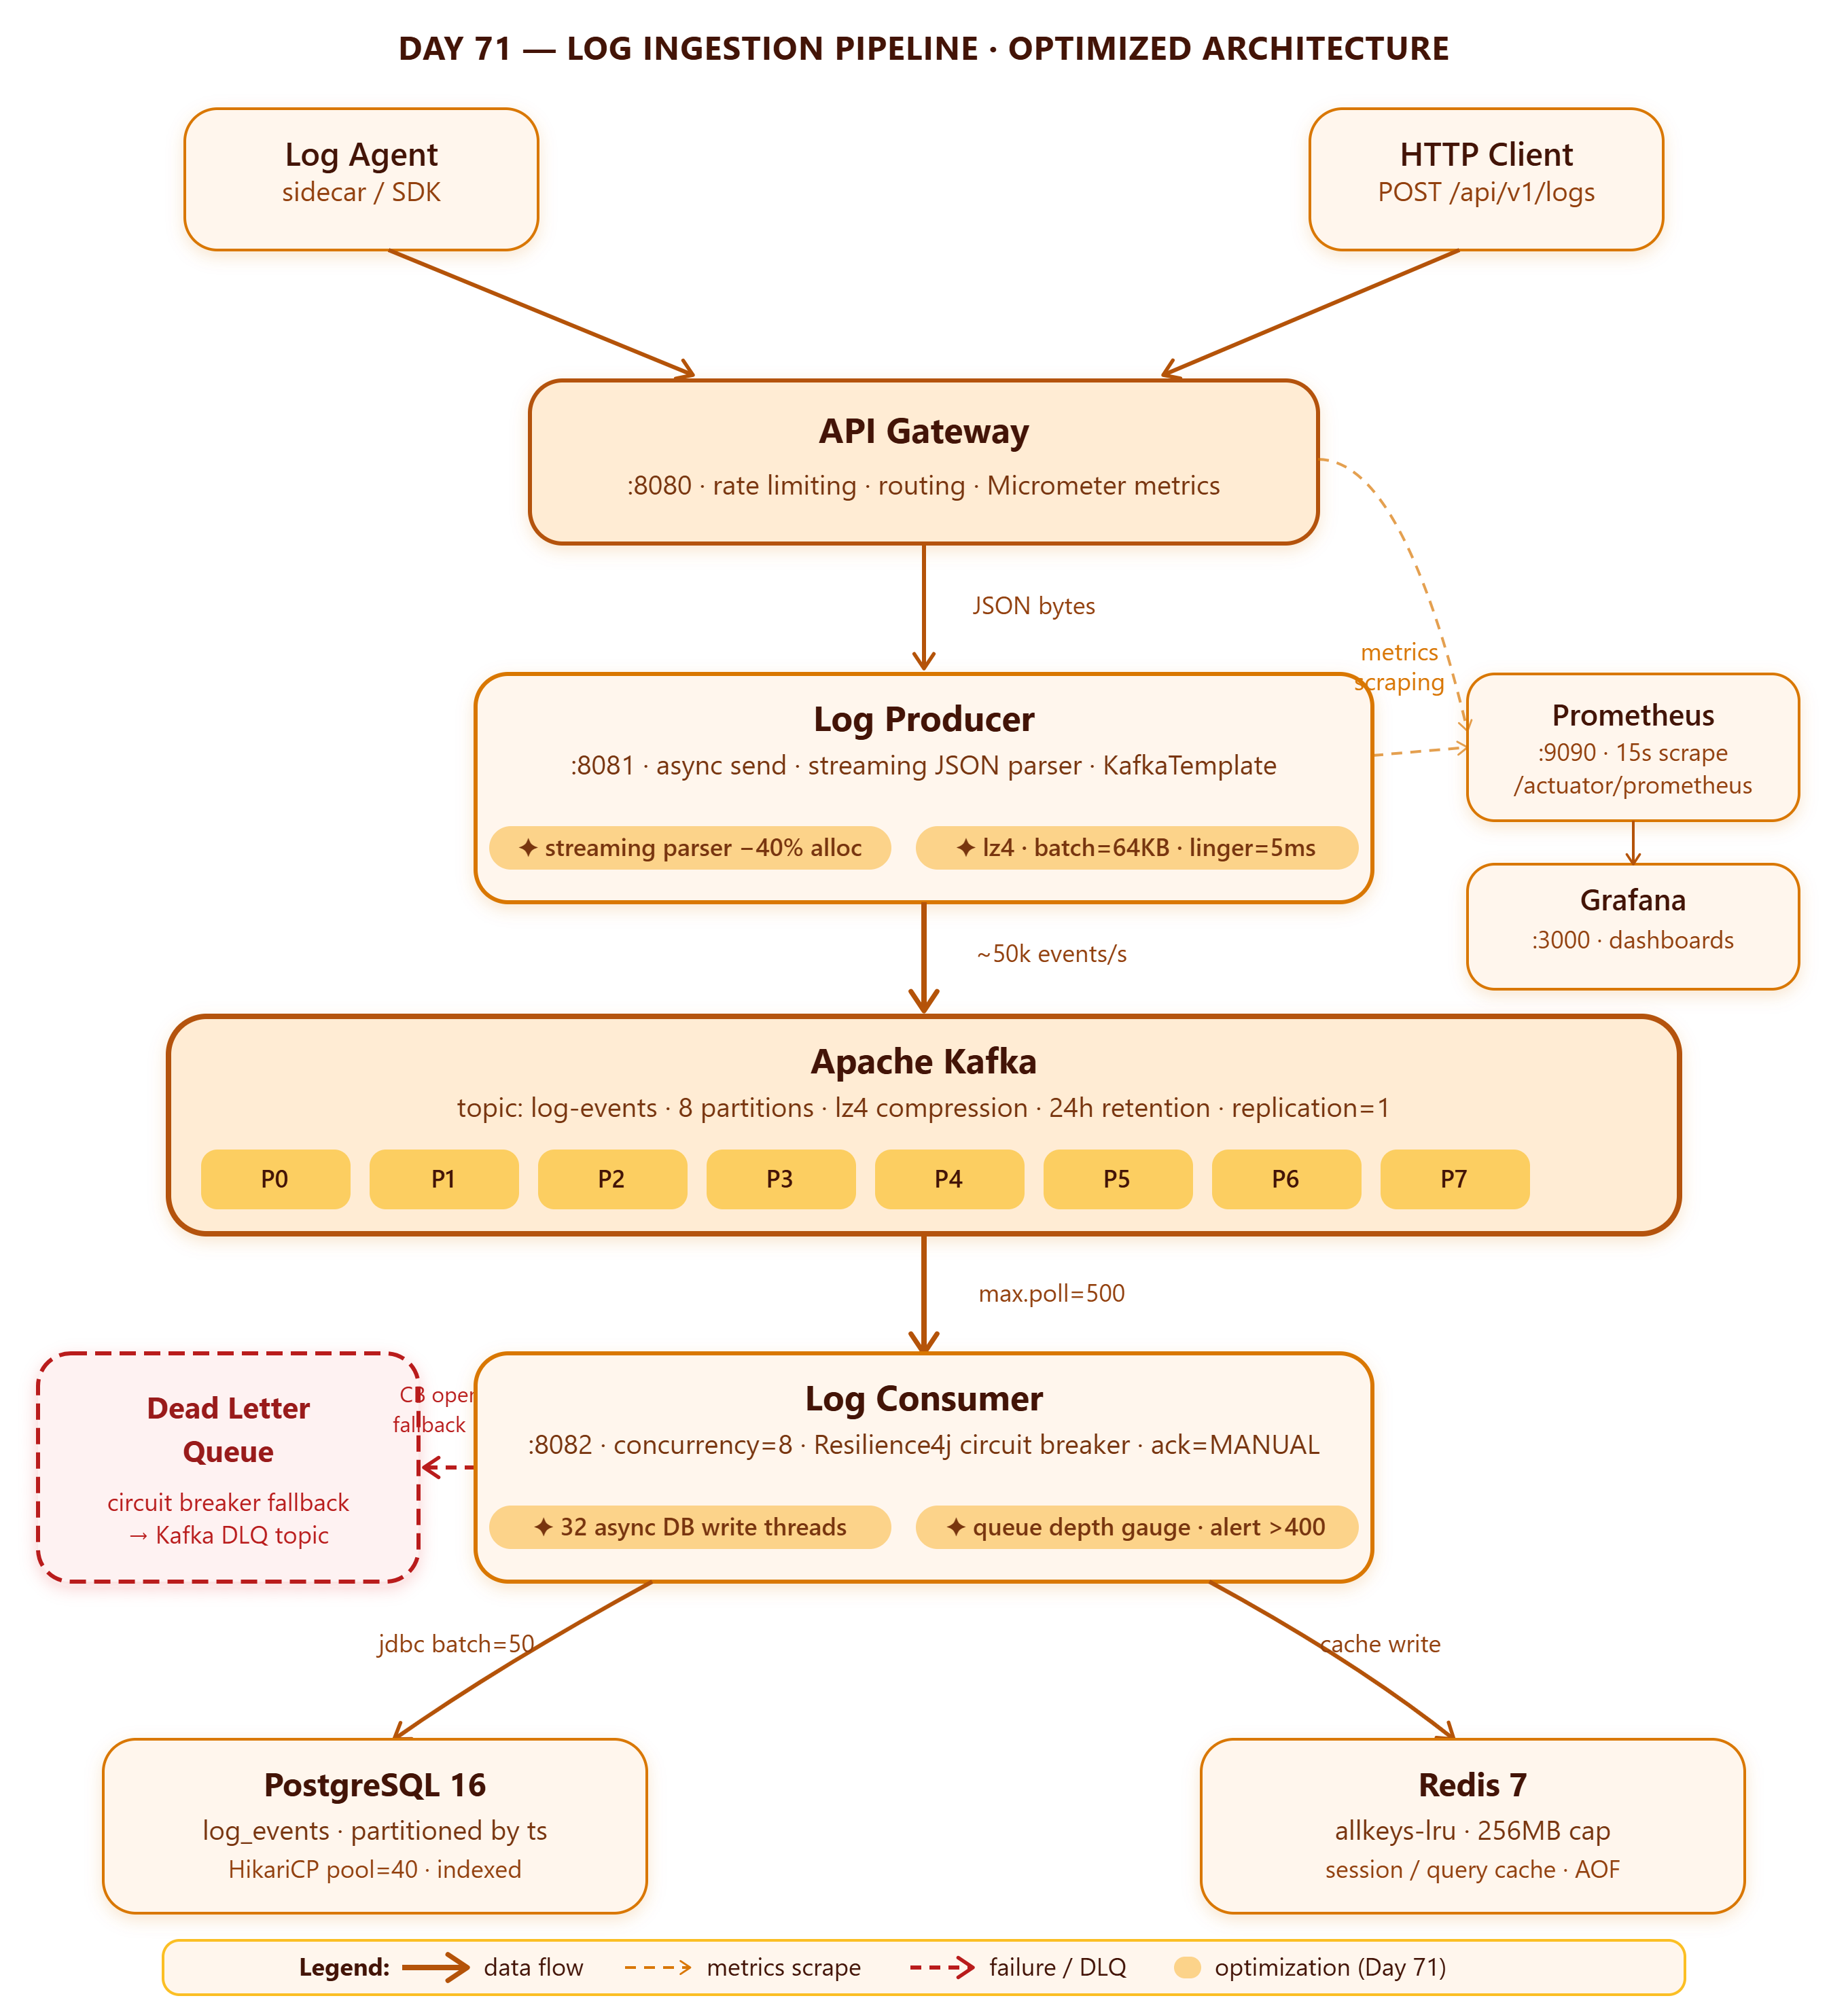
Think of the pipeline as linked queues: HTTP thread pool → deserialization → Kafka producer internal batch buffer → Kafka broker → consumer thread pool → persistence write pool. Little’s Law governs every stage: throughput = concurrency / latency. When one stage saturates, back-pressure ripples upstream. Profiling tells you which queue is the bottleneck.
Anti-pattern: tuning all stages equally. This wastes engineering time and often creates new bottlenecks by overpowering downstream stages.
