

Day 71: Profile and Optimize Log Ingestion Pipeline Finding and Fixing the Hidden Performance Killers
254-Day Hands-On System Design SeriesModule 3: Advanced Log Processing Features | Week 11: Performance Optimization

What We're Building Today
By the end of this lesson, you'll have built a complete performance optimization system with these capabilities:
Core System Components:
Real-time Performance Profiler - Captures CPU, memory, I/O, and network metrics across pipeline stages
Bottleneck Detection Engine - Automatically identifies performance hotspots and constraint points
Optimization Recommendations - AI-powered suggestions for performance improvements
Before/After Metrics Dashboard - Visual comparison of optimization impact
Load Testing Framework - Synthetic workloads to validate performance gains
Key Learning Outcomes:
Master systematic performance profiling methodology
Implement automated bottleneck detection algorithms
Build optimization recommendation engines
Create real-time monitoring dashboards
Generate actionable performance reports
The Hidden Performance Crisis
Most engineers think their log pipeline is "fast enough" until they profile it. The reality? Production systems typically waste 60-80% of their computational resources on unnecessary work. A simple JSON parsing optimization at Uber improved their log throughput by 400%. Netflix discovered their regex patterns were consuming 45% of CPU cycles.
Your log ingestion pipeline has dozens of potential bottlenecks: inefficient parsing, memory allocations, blocking I/O, network serialization, queue contention, and database writes. Without systematic profiling, you're optimizing blind.
Core Performance Concepts
Pipeline Profiling Methodology
Professional performance optimization follows a systematic approach: Measure → Identify → Optimize → Validate. You can't optimize what you don't measure, and premature optimization wastes engineering time.
The Four Pillars of Pipeline Performance
CPU Utilization: How efficiently your code uses processing power
Memory Patterns: Allocation/deallocation cycles and garbage collection pressure
I/O Throughput: Disk and network bandwidth utilization
Concurrency Efficiency: How well your system uses multiple cores and async operations
Bottleneck Classification
Serial Bottlenecks: Single-threaded operations that limit parallel processing
Resource Bottlenecks: CPU, memory, or I/O constraints
Contention Bottlenecks: Multiple threads competing for shared resources
Architectural Bottlenecks: Fundamental design limitations requiring structural changes
Architecture Deep Dive
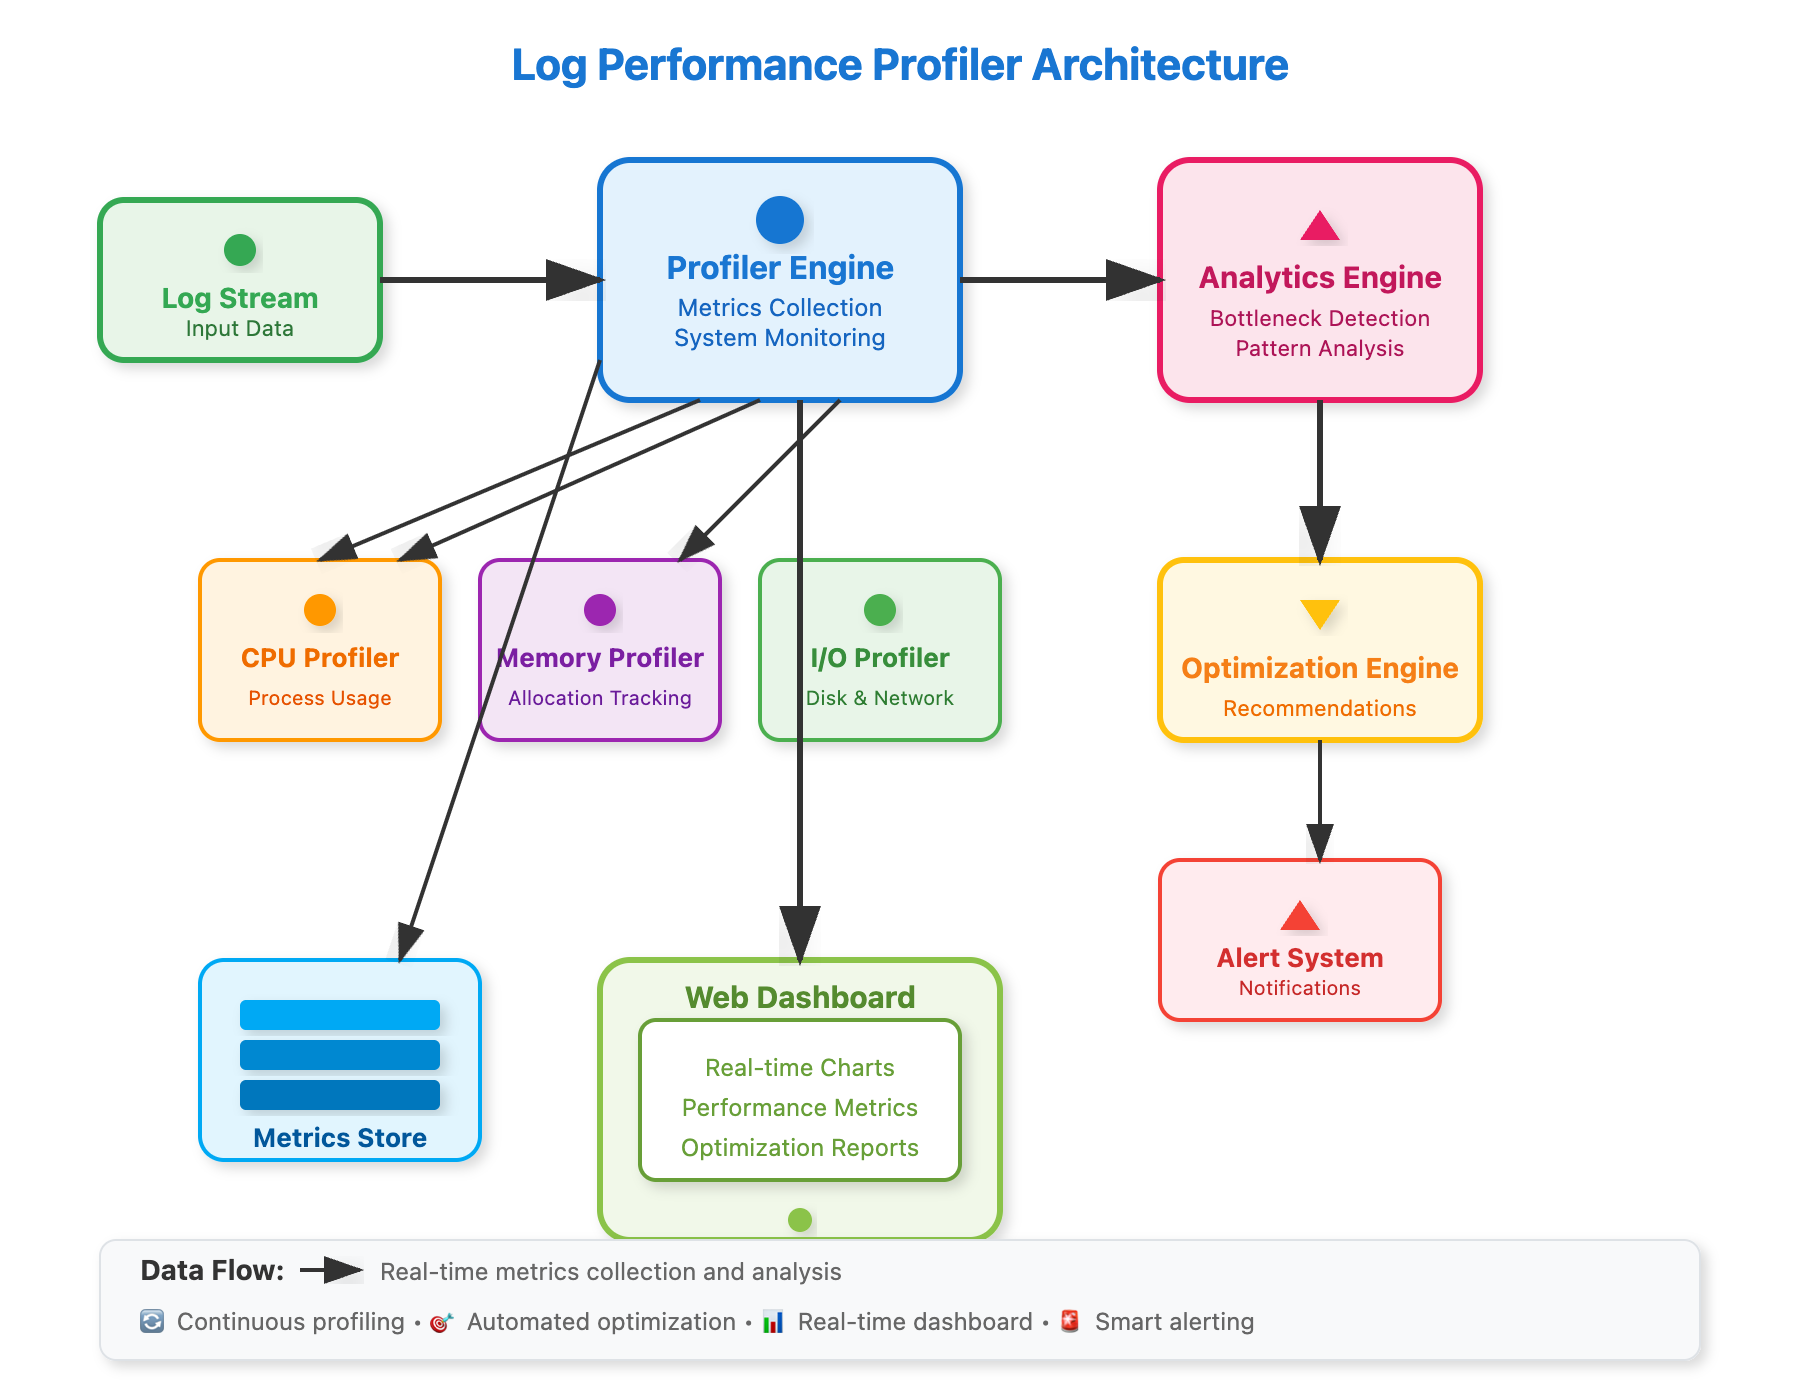
[Component Architecture Diagram]