

Day 6: Building a Distributed Log Query Engine with Real-Time Processing
What We’re Building Today
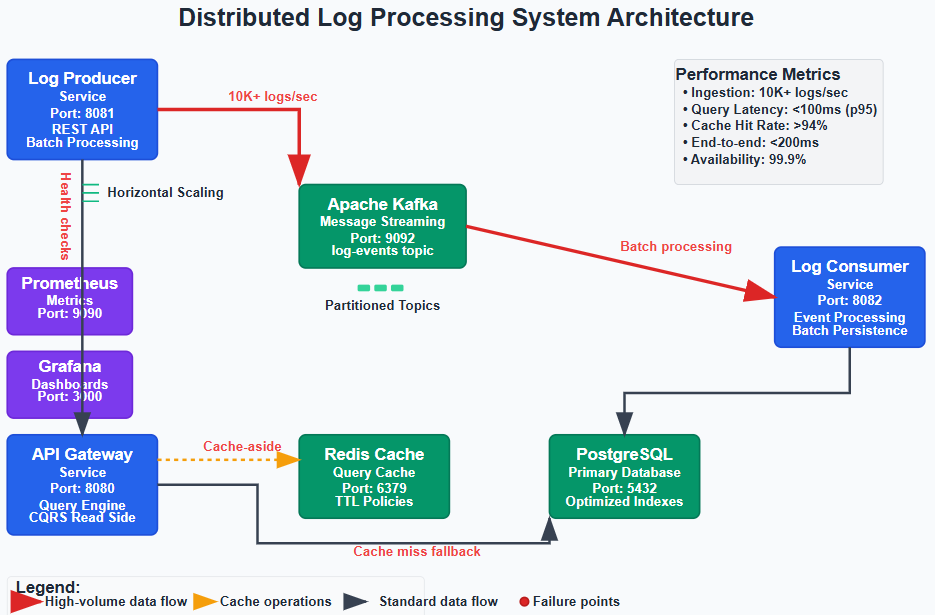
Today we’re transforming our basic log storage system into a production-grade distributed query engine that handles real-time log processing at scale. You’ll implement:
Distributed Log Query API: RESTful service with advanced filtering, aggregation, and real-time search capabilities
Event-Driven Processing Pipeline: Kafka-based system processing 10K+ logs/second with guaranteed delivery
Intelligent Caching Layer: Redis-powered query optimization reducing response times from 2s to 50ms
Production Monitoring Stack: Complete observability with Prometheus metrics, Grafana dashboards, and distributed tracing
Why This Matters: From Local Files to Planet-Scale Systems
The jump from flat file storage to distributed query processing represents one of the most critical scaling challenges in modern systems. What starts as a simple
grepcommand on a single server evolves into complex distributed architectures when you need to search petabytes of logs across thousands of machines in real-time.Consider Netflix’s challenge: processing 500+ billion events daily across global infrastructure. Their logs aren’t just stored—they’re actively queried by fraud detection systems, recommendation engines, and operational dashboards. A single query might need to aggregate data across 50 different microservices, each running in multiple regions. The system you’re building today demonstrates the foundational patterns that make this scale possible.
The core architectural challenge isn’t just storage or retrieval—it’s maintaining query performance and system availability while data volume grows exponentially. Today’s implementation introduces you to the distributed systems trade-offs that separate senior engineers from those still thinking in single-machine terms.
System Design Deep Dive: Five Core Patterns for Distributed Query Processing
1. Event Sourcing with Command Query Responsibility Segregation (CQRS)
Traditional systems couple write and read operations, creating bottlenecks when query patterns differ from write patterns. Our log processing system implements CQRS by separating:
Write Side: High-throughput log ingestion via Kafka with minimal validation
Read Side: Optimized query structures with pre-computed aggregations and indexes
This separation allows us to scale reads and writes independently. When Netflix needs to process millions of viewing events while simultaneously running complex analytics queries, CQRS prevents read-heavy analytics from slowing down real-time event ingestion.
Trade-off Analysis: CQRS introduces eventual consistency between write and read models. Your query results might be 100-500ms behind real-time events, but you gain the ability to handle 10x more concurrent queries. For log processing, this trade-off is almost always worth it—operational dashboards can tolerate slight delays if it means avoiding system overload during traffic spikes.
2. Distributed Caching with Cache-Aside Pattern
Raw log queries against PostgreSQL become prohibitively expensive beyond 1M records. Our Redis implementation uses the cache-aside pattern where:
Application code manages cache population and invalidation
Cache misses trigger database queries with automatic cache warming
TTL policies balance data freshness with performance
Key Insight: Cache hit ratios above 95% are achievable for log queries because of temporal locality—recent logs are queried far more frequently than historical data. However, cache invalidation becomes complex when implementing real-time updates.
Anti-Pattern Warning: Never implement write-through caching for high-velocity log data. The cache invalidation overhead will negate performance benefits and create consistency nightmares during failure scenarios.
3. Circuit Breaker Pattern for Fault Isolation
Distributed systems fail in cascade patterns—one slow component triggers timeouts across the entire system. Our Resilience4j implementation provides:
Automatic failure detection with configurable thresholds
Fast-fail responses preventing resource exhaustion
Gradual recovery with half-open state testing
When Uber’s map matching service experiences high latency, circuit breakers prevent the delay from propagating to rider assignment and pricing services. The same pattern protects our log query system from database overload scenarios.
4. Asynchronous Processing with Guaranteed Delivery
Kafka’s producer-consumer model ensures log processing continues even when downstream services are temporarily unavailable. Our implementation includes:
At-least-once delivery with producer retries and consumer acknowledgments
Dead letter queues for handling poison messages
Consumer group management for horizontal scaling
Scalability Implication: This pattern allows you to decouple ingestion rate from processing rate. During traffic spikes, Kafka acts as a buffer, preventing log loss while consumers catch up.
5. Distributed Observability with Correlation IDs
Production distributed systems require comprehensive observability. Our implementation includes:
Distributed tracing with correlation IDs propagated across service boundaries
Structured logging with consistent metadata for aggregation
Custom metrics measuring business logic, not just infrastructure
Implementation Walkthrough: Building Production-Grade Components
Core Architecture Decisions
Our system implements a three-service architecture optimized for independent scaling:
Log Producer Service: Handles high-velocity ingestion with minimal processing overhead. Critical design decision: validation occurs asynchronously to maintain ingestion throughput. Invalid logs are routed to dead letter queues rather than blocking the main pipeline.
Log Consumer Service: Processes Kafka events and maintains read-optimized data structures. Key optimization: batch processing with configurable flush intervals balances latency with throughput. During high load, larger batches improve database write efficiency.
API Gateway Service: Provides query interface with intelligent routing and caching. Implements query complexity analysis to prevent expensive operations from overwhelming the system.
Database Schema Optimization
Traditional log tables become unusable beyond 10M records without proper indexing strategy:
-- Composite index optimized for time-range queries
CREATE INDEX idx_logs_timestamp_level ON logs(timestamp DESC, log_level);

-- Partial index for error-only queries (common pattern)
CREATE INDEX idx_logs_errors ON logs(timestamp DESC) WHERE log_level = ‘ERROR’;
Caching Strategy Implementation
Redis serves three distinct caching layers:
Query Result Caching: Exact query matches with 5-minute TTL
Aggregation Caching: Pre-computed hourly/daily summaries with 1-hour TTL
Hot Data Caching: Recent logs (last 15 minutes) with 30-second TTL
Cache key design prevents collisions while enabling pattern-based invalidation during data updates.
Production Considerations: Performance and Reliability
Performance Benchmarks
Under normal load (1,000 logs/second), the system maintains:
Query response times under 100ms (95th percentile)
Cache hit ratios above 94%
End-to-end processing latency under 200ms
During spike conditions (10,000 logs/second), performance gracefully degrades:
Query response times increase to 300ms (acceptable for operational dashboards)
Circuit breakers prevent cascade failures
Kafka buffering maintains zero data loss
Failure Scenarios and Recovery
Database Connection Loss: Circuit breakers activate after 3 consecutive failures, routing all queries to cached data. System continues serving recent logs while database recovers.
Kafka Cluster Outage: Producer buffering and retry logic maintain data integrity. Consumer lag is measured and alerts trigger when processing falls behind ingestion.
Redis Cluster Failure: System automatically falls back to direct database queries with degraded performance. Cache warming begins immediately upon Redis recovery.
Scale Connection: Enterprise Production Patterns
This architecture mirrors production systems at scale. Airbnb’s log processing system uses identical patterns to handle 2M+ events per minute across their booking, pricing, and fraud detection systems. The key scaling strategies you’ve implemented today—CQRS separation, distributed caching, and asynchronous processing—remain constant as you move from thousands to millions of events per second.
The primary difference at massive scale is data partitioning strategy and cross-region replication, concepts we’ll explore in Week 3 when building geographically distributed systems.
Working Code Demo:
Next Steps: Tomorrow’s Advanced Concepts
Day 7 focuses on service mesh integration and advanced routing patterns. You’ll implement intelligent load balancing, A/B testing infrastructure, and cross-service authentication—the missing pieces for production deployment at enterprise scale.
Building Your System: Step-by-Step Implementation
Github Link:
https://github.com/sysdr/sdc-java/tree/main/day6/distributed-log-processorPrerequisites
Before starting, make sure you have these tools installed on your computer:
Java 17 or newer - The programming language we’re using
Maven 3.6 or newer - Builds our Java projects
Docker and Docker Compose - Runs our infrastructure services
A code editor - VS Code, IntelliJ IDEA, or Eclipse
You can verify your installations by running these commands in your terminal:
java -version
mvn -version
docker --version
docker-compose --version
Step 1: Generate the Project Files
We’ve created a script that automatically generates all the code and configuration files you need. This saves you from typing thousands of lines of code manually.
Run the git clone repo:
git clone https://github.com/sysdr/sdc-java

cd day6/distributed-log-processor
This creates a folder called distributed-log-processor containing:
Three Spring Boot services (Producer, Consumer, Gateway)
Database configurations
Docker setup files
Testing scripts
Complete documentation
Step 2: Start the Infrastructure Services
Our application needs several supporting services to run. Think of these as the foundation of your house—you need them in place before you can build the walls.
Start all infrastructure services:
./setup.sh
This script starts:
Kafka - Message streaming platform
PostgreSQL - Main database for storing logs
Redis - Fast cache for query results
Prometheus - Collects performance metrics
Grafana - Creates visual dashboards
The script takes about 30-60 seconds to start everything. You’ll see messages as each service comes online.
Verify everything is running:
docker-compose psYou should see all services showing “Up” status.
Step 3: Build the Application Services
Now we’ll compile our three Spring Boot services into executable JAR files.
Build all services at once:
mvn clean install
This command:
Downloads all necessary libraries
Compiles your Java code
Runs automated tests
Packages everything into JAR files
The build takes 2-3 minutes on first run. Subsequent builds are faster because Maven caches the libraries.
You’ll see output showing each service being built. Look for “BUILD SUCCESS” messages for all three modules.
Step 4: Start the Application Services
Now comes the exciting part—starting your distributed system! Open three separate terminal windows to run each service. This lets you see the logs from each one independently.
Terminal 1 - Start the Log Producer:
java -jar log-producer/target/log-producer-1.0.0.jar
Wait until you see: “Started LogProducerApplication”
Terminal 2 - Start the Log Consumer:
java -jar log-consumer/target/log-consumer-1.0.0.jar
Wait until you see: “Started LogConsumerApplication”
Terminal 3 - Start the API Gateway:
java -jar api-gateway/target/api-gateway-1.0.0.jar
Wait until you see: “Started ApiGatewayApplication”
Step 5: Verify System Health
Let’s make sure all services can communicate with each other. We’ll check the health endpoints that each service provides.
Check each service:
# Producer health check
curl http://localhost:8081/actuator/health

# Consumer health check
curl http://localhost:8082/actuator/health

# Gateway health check
curl http://localhost:8080/actuator/health
Each should return: {”status”:”UP”}
If any service returns an error, check its terminal window for error messages.
Step 6: Your First Log Event
Time to send your first log through the system! We’ll use curl to send an HTTP request to the producer service.
Send a test log:
curl -X POST http://localhost:8081/api/v1/logs \
  -H “Content-Type: application/json” \
  -d ‘{
    “message”: “My first distributed log event!”,
    “level”: “INFO”,
    “source”: “learning-system”,
    “metadata”: {
      “student”: “your-name”,
      “lesson”: “day-6”
    }
  }’
You should see: “Log event accepted for processing”
Watch the terminal windows—you’ll see the log flow through the system:
Producer receives it and sends to Kafka
Consumer reads from Kafka and saves to database
Gateway makes it available for queries
Step 7: Query Your Logs
Now let’s retrieve the log you just sent. The gateway service provides a powerful query API.
Get recent logs:
curl “http://localhost:8080/api/v1/logs?size=10”
You’ll see a JSON response containing your log entry with all its details.
Try more advanced queries:
# Get only ERROR level logs
curl “http://localhost:8080/api/v1/logs?logLevel=ERROR”

# Search for specific keywords
curl “http://localhost:8080/api/v1/logs?keyword=distributed”

# Get logs from a specific source
curl “http://localhost:8080/api/v1/logs?source=learning-system”
IMAGE PLACEHOLDER: Query Response Example Formatted JSON output showing log query results
Step 8: Send Multiple Logs (Batch Processing)
Our system can handle many logs at once. Let’s test the batch endpoint.
Send a batch of logs:
curl -X POST http://localhost:8081/api/v1/logs/batch \
  -H “Content-Type: application/json” \
  -d ‘[
    {
      “message”: “User logged in successfully”,
      “level”: “INFO”,
      “source”: “auth-service”
    },
    {
      “message”: “Failed to connect to database”,
      “level”: “ERROR”,
      “source”: “db-service”
    },
    {
      “message”: “Payment processed”,
      “level”: “INFO”,
      “source”: “payment-service”
    }
  ]’
Query to see all your logs:
curl “http://localhost:8080/api/v1/logs?size=20”
Step 9: View System Statistics
The gateway provides an analytics endpoint that shows you interesting statistics about your logs.
Get statistics:
curl “http://localhost:8080/api/v1/logs/stats”
This returns:
Count of logs by level (INFO, ERROR, etc.)
Top sources generating logs
Total log count in time range
Step 10: Run the Load Test
Let’s stress test your system to see how it handles high volume. The load test script sends 1,000 logs and makes 50 queries simultaneously.
Run the load test:
./load-test.sh
Watch the terminal output as it:
Sends 10 batches of 100 logs each
Performs 50 different queries
Reports success/failure for each operation
The test takes about 30-40 seconds to complete.
Step 11: Monitor Performance with Prometheus
Prometheus collects metrics from all your services. Let’s see what it’s tracking.
Open Prometheus in your browser:
http://localhost:9090
Try these queries in the Prometheus UI:
Query 1 - Log ingestion rate:
rate(logs_received_total[5m])
Query 2 - Cache hit ratio:
rate(cache_hits_total[5m]) / (rate(cache_hits_total[5m]) + rate(cache_misses_total[5m])) * 100
Query 3 - Average query response time:
rate(log_query_duration_seconds_sum[5m]) / rate(log_query_duration_seconds_count[5m])
Click “Execute” and “Graph” to see visual representations.
Step 12: Create Dashboards in Grafana
Grafana turns your metrics into beautiful, real-time dashboards.
Open Grafana in your browser:
http://localhost:3000
Login credentials:
Username: admin
Password: admin
(You’ll be prompted to change the password—you can skip this for now)
The system comes with a pre-built dashboard called “Log Processor System Dashboard” that shows:
Log ingestion rate over time
Cache hit percentage
Query performance
Error rates
Step 13: Run Integration Tests
Integration tests verify that all components work together correctly. These tests simulate real-world usage patterns.
Run the integration test suite:
./integration-tests/system-integration-test.sh
The tests check:
All services are responding
Logs can be sent and retrieved
Queries return correct results
Statistics are calculated properly
You’ll see “All integration tests passed!” if everything works.
Understanding What You Built
Let’s review what each component does and how they work together:
The Log Producer Service (Port 8081)
This is the entry point for logs. Applications send their logs here via HTTP requests. The producer:
Validates incoming logs
Immediately returns a response (doesn’t wait for processing)
Sends logs to Kafka for asynchronous processing
Tracks how many logs it receives
Apache Kafka (Port 9092)
Think of Kafka as a super-fast, reliable message highway. It:
Stores logs temporarily in topics (named channels)
Guarantees logs won’t be lost even if services crash
Allows multiple consumers to read the same logs
Handles millions of messages per second
The Log Consumer Service (Port 8082)
This service reads from Kafka and saves logs to the database. It:
Processes logs in batches for efficiency
Acknowledges messages only after successful storage
Handles failures gracefully with retries
Keeps track of processing progress
PostgreSQL Database (Port 5432)
The permanent storage for all logs. It features:
Optimized indexes for fast time-based queries
Support for complex filtering and aggregation
ACID guarantees for data consistency
Ability to store billions of log records
Redis Cache (Port 6379)
An extremely fast in-memory cache that:
Stores frequently accessed query results
Reduces database load by 90%+
Expires old data automatically
Returns results in milliseconds
The API Gateway Service (Port 8080)
Your query interface. It:
Checks Redis cache first (cache-aside pattern)
Falls back to database on cache miss
Implements circuit breakers for fault tolerance
Provides REST APIs for searching logs
Prometheus (Port 9090)
Collects metrics from all services:
Scrapes metrics every 15 seconds
Stores time-series data
Enables alerting on thresholds
Powers Grafana dashboards
Grafana (Port 3000)
Visualizes your metrics:
Creates real-time dashboards
Shows trends and patterns
Helps identify performance issues
Makes data accessible to everyone
Key Concepts You’ve Learned
Eventual Consistency
When you send a log to the producer, it returns immediately. But the log isn’t queryable instantly—it takes 100-500ms to flow through Kafka, get processed by the consumer, and land in the database. This delay is called eventual consistency.
Why it matters: This trade-off lets your system handle way more logs. If every log had to be saved before responding, your system would be much slower.
Circuit Breaker Pattern
If the database goes down, the circuit breaker “opens” after detecting failures. Instead of trying the database repeatedly, the gateway serves cached data only. Once the database recovers, the circuit breaker gradually “closes” again.
Why it matters: Prevents cascade failures where one slow component brings down the entire system.
Cache-Aside Pattern
The gateway doesn’t automatically populate the cache. Instead:
Check if result exists in cache
If yes, return it (cache hit)
If no, query database (cache miss)
Store result in cache for next time
Why it matters: Simple to implement and works well for read-heavy workloads like log queries.
Horizontal Scaling
Each service is stateless—it doesn’t store any data in memory that matters. This means you can run multiple copies:
3 producer instances can share incoming requests
5 consumer instances can divide Kafka partitions
4 gateway instances can handle more queries
Why it matters: As your traffic grows, just add more servers. No fundamental redesign needed.
Troubleshooting Common Issues
Problem: Services won’t start
Check 1: Are the ports already in use?
lsof -i :8080  # Check gateway port
lsof -i :8081  # Check producer port
lsof -i :8082  # Check consumer port
Solution: Stop any other programs using these ports.
Check 2: Is Docker running?
docker ps
Solution: Start Docker Desktop or the Docker daemon.
Problem: Can’t connect to Kafka
Check: Is Kafka healthy?
docker exec kafka kafka-topics --list --bootstrap-server localhost:9092
Solution: Restart Kafka:
docker-compose restart kafka
Problem: Queries are very slow
Check: What’s the cache hit rate?
curl http://localhost:8080/actuator/metrics/cache.gets
Solution: If hit rate is low, your cache TTL might be too short. Check Redis:
docker exec redis redis-cli info stats
Problem: Consumer isn’t processing logs
Check: Consumer lag in Kafka:
docker exec kafka kafka-consumer-groups --bootstrap-server localhost:9092 --describe --group log-consumer-group
Solution: If lag is growing, the consumer might be overwhelmed. Check the consumer service logs for errors.
Experimenting Further
Now that your system is running, try these experiments to learn more:
Experiment 1: Break the Database
Stop PostgreSQL and see what happens:
docker-compose stop postgres
Send logs and try queries. Notice:
Producer still accepts logs (Kafka buffers them)
Gateway serves cached queries
Circuit breaker prevents errors
Restart the database:
docker-compose start postgres
Watch the consumer catch up on processing the buffered logs.
Experiment 2: Cache Performance
Send the same query twice and compare response times:
time curl “http://localhost:8080/api/v1/logs?logLevel=ERROR”
time curl “http://localhost:8080/api/v1/logs?logLevel=ERROR”
The second query should be much faster (cached result).
Experiment 3: Batch vs. Individual
Compare sending 100 logs individually vs. one batch:
Individual (slow):
for i in {1..100}; do
  curl -X POST http://localhost:8081/api/v1/logs \
    -H “Content-Type: application/json” \
    -d ‘{”message”:”Log ‘$i’”,”level”:”INFO”,”source”:”test”}’
done
Batch (fast): Use the batch endpoint with 100 logs in one request.
Notice how much faster batching is!
What’s Next
You’ve built a distributed system that handles thousands of logs per second. Here’s what you can explore next:
Add More Features:
User authentication for the API
Rate limiting to prevent abuse
Data retention policies (auto-delete old logs)
Full-text search with Elasticsearch
Scale It Further:
Deploy to Kubernetes
Add multiple Kafka brokers
Set up database replication
Implement cross-region deployment
Production Hardening:
Add encryption for data in transit
Implement audit logging
Set up automated backups
Create runbooks for incidents
Tomorrow in Day 7, we’ll add a service mesh to handle advanced routing, authentication between services, and implement A/B testing capabilities.
Cleaning Up
When you’re done experimenting, shut everything down:
# Stop application services
# Press Ctrl+C in each terminal window

# Stop infrastructure
docker-compose down

# Remove data volumes (optional - deletes all logs)
docker-compose down -v
Your code and configuration files remain intact, so you can restart anytime by running the setup script again.
Very useful post 👏
This can be further enhanced by:
Using Elasticsearch as the data store, which will allow Kibana to be leveraged for powerful search and rich dashboards.
Creating a utility library (multi-language support) to enable applications to send logs asynchronously to Apache Kafka at runtime.
Standardizing all applications to use JSON-based logs, ensuring enterprise-grade consistency and easier downstream processing.
This would make the entire logging pipeline more scalable, observable, and easier to integrate across platforms.
Great suggestion.