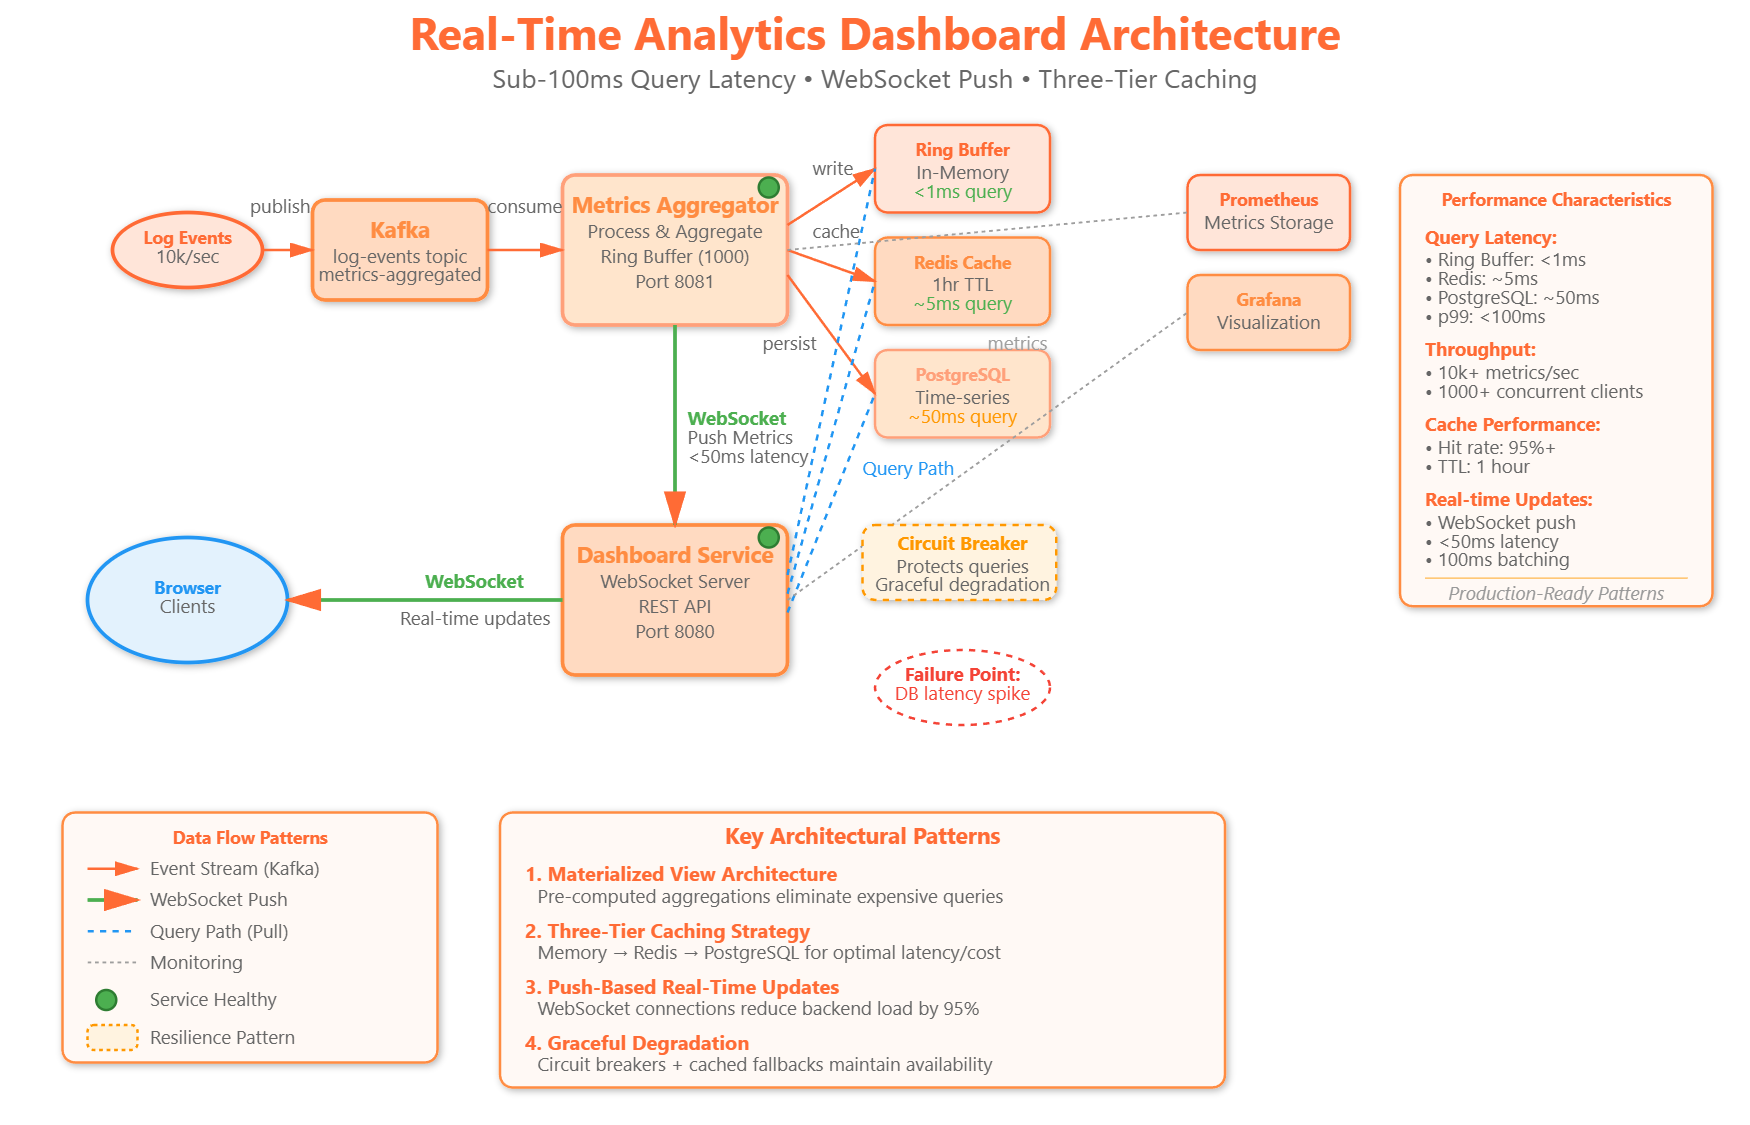
What We’re Building Today
Real-time analytics dashboard consuming aggregated metrics from Kafka streams
WebSocket-based push architecture delivering sub-second metric updates to browsers
Multi-dimensional visualization service supporting time-series, histograms, and geographic heatmaps
Query optimization layer with Redis caching and PostgreSQL time-series partitioning
Why This Matters
At scale, the gap between generating metrics and making them actionable determines your incident response time. Netflix processes 500 billion events daily, but their dashboard systems compress this into 200ms query responses because engineers can’t wait 30 seconds to see if a deployment broke something. When Uber’s surge pricing algorithms trigger, dashboard systems must surface the decision rationale within 100ms or drivers can’t understand why rates changed.
The architectural challenge isn’t building charts—it’s designing systems that maintain query responsiveness as data volume grows exponentially. Your dashboard becomes the bottleneck between detecting problems and fixing them. Poor dashboard architecture means your monitoring system generates alerts 5 minutes before your engineers can see the underlying data.
System Design Deep Dive