

Day 44: Real-time Monitoring Dashboard with Kafka Streams
From Zero to Production: Building Real-time Analytics that Scale - 254-Day Hands-On System Design Series

🎯 What We're Building Today
Today we're constructing a production-grade real-time monitoring dashboard that transforms raw Kafka streams into actionable business intelligence:
Stream Processing Engine - Kafka Streams API with windowed aggregations
Real-time Web Dashboard - Flask + WebSocket for live updates
Geographic Traffic Analysis - IP-based location tracking and visualization
Intelligent Alerting System - Configurable thresholds with email notifications
Custom Business Metrics - KPI tracking and pattern analysis
🏗️ The Production Reality
When Netflix processes 100TB of logs daily or when Uber tracks millions of ride events in real-time, they're not just storing data—they're extracting instant insights. The gap between a log event happening and a business decision being made can determine competitive advantage.
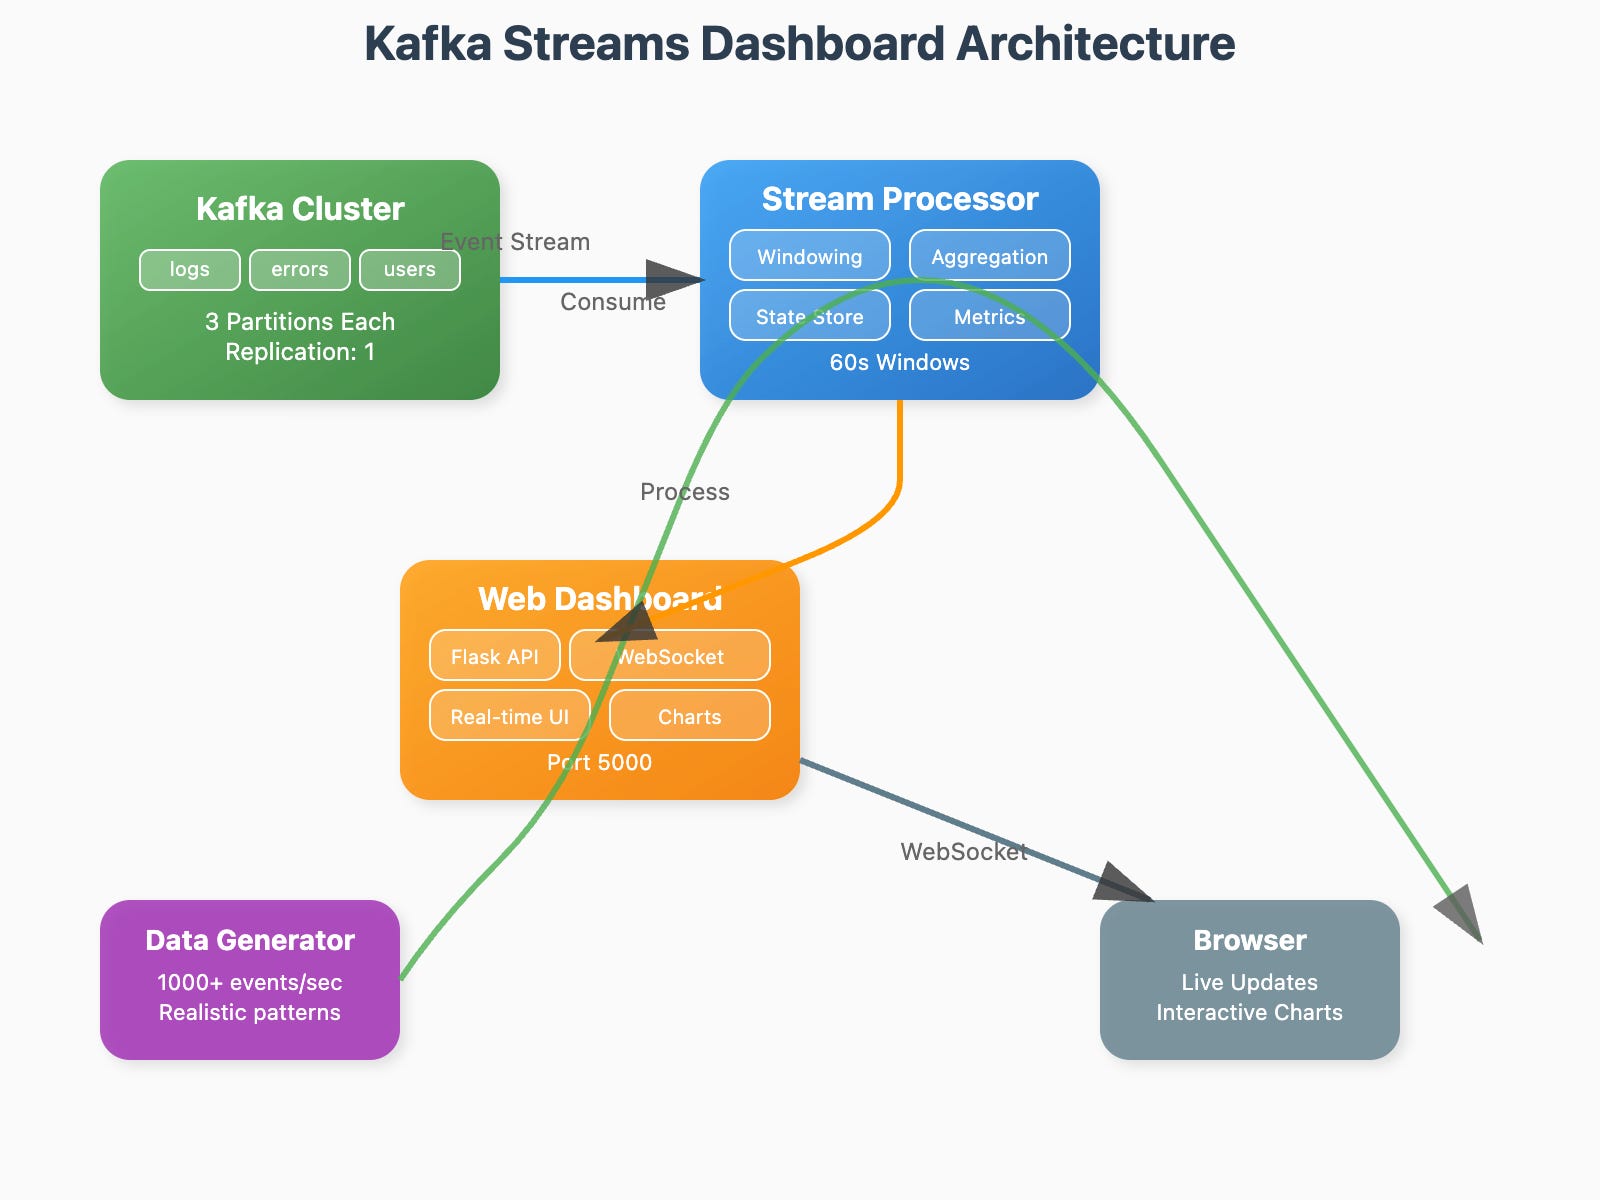
[📊 ARCHITECTURE DIAGRAM ]