
The Problem That Keeps Engineers Awake
Picture this: Your log processing system is humming along, handling thousands of log entries per second. Suddenly, a malformed JSON log from a legacy service crashes your parser. Without proper handling, that single bad message could block your entire processing pipeline, creating a cascading failure that brings down your monitoring system.
This is where dead letter queues (DLQs) become your system's insurance policy.
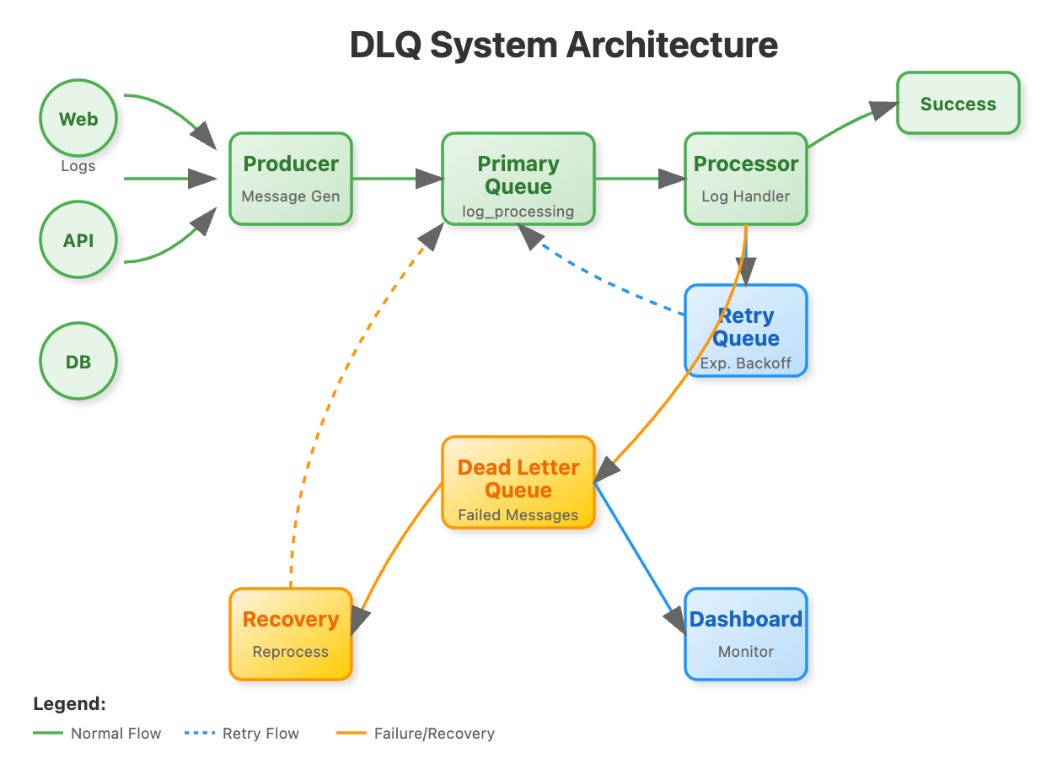
What Are Dead Letter Queues?
GitHub Link:
https://github.com/sysdr/course-p/tree/main/day36Think of a dead letter queue as the "lost and found" box for your message processing system. When a message fails to process after multiple attempts—whether due to malformed data, temporary service outages, or processing errors—instead of losing it forever or letting it block other messages, you route it to a special holding area: the dead letter queue.
Why DLQs Matter in Log Processing
In distributed log processing systems, failure is not an exception—it's a certainty. You'll encounter:
Malformed log entries from various services with different formats
Temporary downstream service failures when writing processed logs
Resource exhaustion during high-traffic periods
Parsing errors from unexpected log schemas
Without DLQs, failed messages either get lost (bad for compliance and debugging) or block the entire queue (bad for system availability). With DLQs, you maintain both data integrity and system resilience.
Real-World Context
Netflix uses similar patterns to handle millions of streaming events daily. When their recommendation engine can't process a user interaction immediately, the event goes to a DLQ rather than blocking real-time personalization for other users. Later, batch jobs analyze DLQ patterns to improve system resilience.
Core Implementation Strategy
Your DLQ implementation includes:
Failure Detection: Catch exceptions and classify them (retryable vs. permanent)
Retry Logic: Implement exponential backoff with maximum retry limits
Message Enrichment: Add failure metadata (timestamp, error type, attempt count)
Monitoring: Track DLQ growth rates and failure patterns
Recovery Mechanisms: Provide tools to reprocess DLQ messages
Key Design Decisions
Retry Strategy: Use exponential backoff (1s, 2s, 4s, 8s) to avoid overwhelming failing services while giving temporary issues time to resolve.
Message Enrichment: Store original message, error details, timestamps, and retry count. This context is crucial for debugging and deciding recovery strategies.
DLQ Sizing: Size your DLQ based on expected failure rates. A healthy system typically sees 0.1-2% failure rates, but plan for spike scenarios.
🛠️ Hands-On Implementation
Project Overview
We'll build a complete DLQ system with:
Message Producer with realistic log generation
Primary Processor with failure simulation
Dead Letter Queue management
Real-time Web Dashboard
Recovery and reprocessing tools
Docker containerization
Quick Start Installation
Day36
git clone https://github.com/sysdr/course.git.
https://github.com/sysdr/course/tree/main/day36
# Clone/create project directory
mkdir dlq_log_processor && cd dlq_log_processor
# Run the complete setup script
curl -sSL https://your-repo.com/setup.sh | bash
# Or use the implementation script provided
# Start system
python run.py
Core Components Built
1. Message Models (src/models.py)
@dataclass
class LogMessage:
id: str
timestamp: datetime
level: LogLevel
source: str
message: str
metadata: Dict[str, Any] = field(default_factory=dict)
def to_dict(self) -> Dict[str, Any]:
return {
"id": self.id,
"timestamp": self.timestamp.isoformat(),
"level": self.level.value,
"source": self.source,
"message": self.message,
"metadata": self.metadata
}
2. Smart Producer (src/producer.py)
Generates realistic log messages with various patterns
Includes intentionally problematic messages for testing
Configurable message rates and types
3. Resilient Processor (src/processor.py)
Processes messages with failure classification
Implements exponential backoff retry logic
Routes failed messages to appropriate queues
4. DLQ Handler (src/dlq_handler.py)
Manages dead letter queue operations
Provides failure analysis and pattern recognition
Enables message reprocessing and recovery
5. Real-time Dashboard (src/dashboard.py)
WebSocket-based live monitoring
Interactive message management
Failure pattern visualization
🧪 Build, Test & Verify Guide
Environment Setup
# Verify prerequisites
python --version # 3.12+
redis-cli --version # 6.0+
# Setup virtual environment
python -m venv dlq_env
source dlq_env/bin/activate # Linux/Mac
# dlq_env\Scripts\activate # Windows
# Install dependencies
pip install -r requirements.txt
Redis Setup Options
Option A: Local Redis
redis-server --daemonize yes
redis-cli ping # Should return PONG
Option B: Docker Redis
docker-compose up -d redis
docker-compose exec redis redis-cli pingTesting Pipeline
1. Unit Tests
python -m pytest tests/ -v
# Expected: All tests pass with >80% coverage2. Component Testing
# Test message generation
python -c "
from src.producer import LogProducer
import asyncio
async def test():
producer = LogProducer()
message = producer.generate_log_message()
print(f'✅ Generated: {message.id}')
await producer.close()
asyncio.run(test())
"3. Integration Testing
# Run demonstration
python demo.py
# Expected output:
# 🎭 DLQ System Demonstration
# 🧹 Cleared existing DLQ data
# 🏭 Producing 100 log messages...
# ⚙️ Processing messages for 10 seconds...
# 📊 Final Stats: [displays message counts]
# ✅ Demonstration completed!System Verification
# Start complete system
python run.py &
# Verify components
curl -f http://localhost:8000/ # Dashboard accessible
redis-cli ping # Redis responsive
redis-cli llen log_processing # Queue has messages
# Check processing
redis-cli llen dead_letter_queue # DLQ receiving failures
redis-cli hlen processed_logs # Messages being processed🎭 DLQ Behavior Simulation
Understanding Failure Scenarios
To truly understand DLQ behavior, we need to simulate real failures:
Simulate Parsing Errors
python -c "
import asyncio
import redis.asyncio as redis
async def inject_broken():
r = redis.from_url('redis://localhost:6379')
broken_messages = [
'{\"id\": \"broken-1\", \"invalid\": json}',
'not json at all',
'{\"incomplete\": \"missing fields\"'
]
for msg in broken_messages:
await r.lpush('log_processing', msg)
print('✅ Injected malformed messages')
await r.close()
asyncio.run(inject_broken())
"Simulate Network Failures
# Create network-prone messages
python -c "
import asyncio
from src.producer import LogProducer
from src.models import LogMessage, LogLevel
from datetime import datetime
import json
async def network_errors():
producer = LogProducer()
for i in range(5):
message = LogMessage(
id=f'network-fail-{i}',
timestamp=datetime.now(),
level=LogLevel.ERROR,
source='external-api',
message='External API call failed - timeout',
metadata={'api_endpoint': 'https://failing-service.com/api'}
)
await producer.redis.lpush('log_processing',
json.dumps(message.to_dict(), default=str))
print('✅ Created network-failure messages')
await producer.close()
asyncio.run(network_errors())
"Complete Simulation Script
Use the comprehensive simulator:
# Run specific failure scenarios
python dlq_simulator.py parsing # Parsing errors
python dlq_simulator.py overload # System overload
python dlq_simulator.py full # Complete simulation
# Monitor results in real-time
# Dashboard: http://localhost:8000
# Queue lengths: redis-cli llen dead_letter_queueSimulation Results
The simulator demonstrates:
Failure Classification: Different error types route correctly
Retry Exhaustion: Messages retry 3 times before DLQ
Recovery Mechanisms: Failed messages can be reprocessed
Pattern Analysis: Failure trends become visible
📊 Production Insights
Monitoring is Critical
Set alerts for DLQ growth rates. A sudden spike often indicates upstream system issues or data quality problems.
Categorize Failures
Not all failures are equal. Distinguish between transient failures (retry these) and poison messages (need manual intervention).
Capacity Planning
DLQs can grow rapidly during incidents. Ensure adequate storage and processing capacity for recovery operations.
✅ Success Verification Checklist
Core Functionality
[ ] Messages produce and queue successfully
[ ] Failed messages route to DLQ after retries
[ ] Dashboard shows real-time statistics
[ ] Recovery mechanisms work correctly
[ ] Docker deployment succeeds
Performance Benchmarks
[ ] System handles 100+ messages/second
[ ] Memory usage remains stable under load
[ ] DLQ analysis provides actionable insights
[ ] Recovery operations complete without errors
Error Handling
[ ] Malformed messages don't crash system
[ ] Network errors trigger proper retries
[ ] Resource errors are categorized correctly
[ ] Unknown errors are captured and logged
🎯 Assignment: Failure Pattern Recognition
Build an intelligent failure classification system that:
Categorizes failures by type (parsing, network, resource)
Implements different retry strategies per failure type
Automatically escalates persistent failures to operations teams
Provides failure trend analysis over time
Implementation Hints
class FailureClassifier:
def classify_error(self, error: Exception, message: str) -> FailureType:
if isinstance(error, json.JSONDecodeError):
return FailureType.PARSING_ERROR
elif "connection" in str(error).lower():
return FailureType.NETWORK_ERROR
elif "memory" in str(error).lower():
return FailureType.RESOURCE_ERROR
return FailureType.UNKNOWN_ERROR
def get_retry_strategy(self, failure_type: FailureType) -> RetryStrategy:
strategies = {
FailureType.PARSING_ERROR: RetryStrategy(max_retries=1),
FailureType.NETWORK_ERROR: RetryStrategy(max_retries=5),
FailureType.RESOURCE_ERROR: RetryStrategy(max_retries=3)
}
return strategies.get(failure_type, RetryStrategy(max_retries=2))🚀 Troubleshooting Guide
Common Issues
Redis Connection Errors
redis-cli ping # Test connectivity
redis-server --daemonize yes # Restart if neededPort Conflicts
lsof -i :8000 # Check port usage
kill -9 <PID> # Kill conflicting processImport Errors
export PYTHONPATH=$PYTHONPATH:$(pwd)
python -c "from src.models import LogMessage; print('✅ Imports work')"Docker Issues
docker-compose down && docker system prune -f
docker-compose build --no-cache
docker-compose up -d🎊 What's Next
Tomorrow in Day 37, you'll implement priority queues for critical log messages—building on your DLQ foundation to create systems that gracefully degrade under load while maintaining service for critical operations.
The combination of DLQs and priority handling creates systems that are truly production-ready, handling both failure scenarios and performance requirements that separate hobby projects from enterprise-grade distributed systems.
Key Takeaways
Dead Letter Queues are essential for production resilience
Failure classification enables intelligent handling of different error types
Exponential backoff prevents cascading failures while allowing recovery
Real-time monitoring reveals system health and failure patterns
Recovery mechanisms ensure no data loss even during extended outages
Ready to master distributed systems? Reply with your DLQ implementation results and questions for personalized feedback.
📊 Resources:
This is part of our comprehensive 254-day system design series. Each lesson builds production-ready skills used by engineers at Netflix, Uber, and other tech giants.
Share this with your engineering team • Try the implementation • Join our community


