
What We’re Building Today
Dead Letter Queue infrastructure for capturing and analyzing failed log processing attempts with automatic retry mechanisms
Poison message detection system that prevents infinite retry loops and isolates problematic events
DLQ monitoring dashboard with Grafana visualizations showing failure patterns, retry metrics, and message inspection capabilities
Reprocessing pipeline enabling manual intervention and automated recovery from transient failures
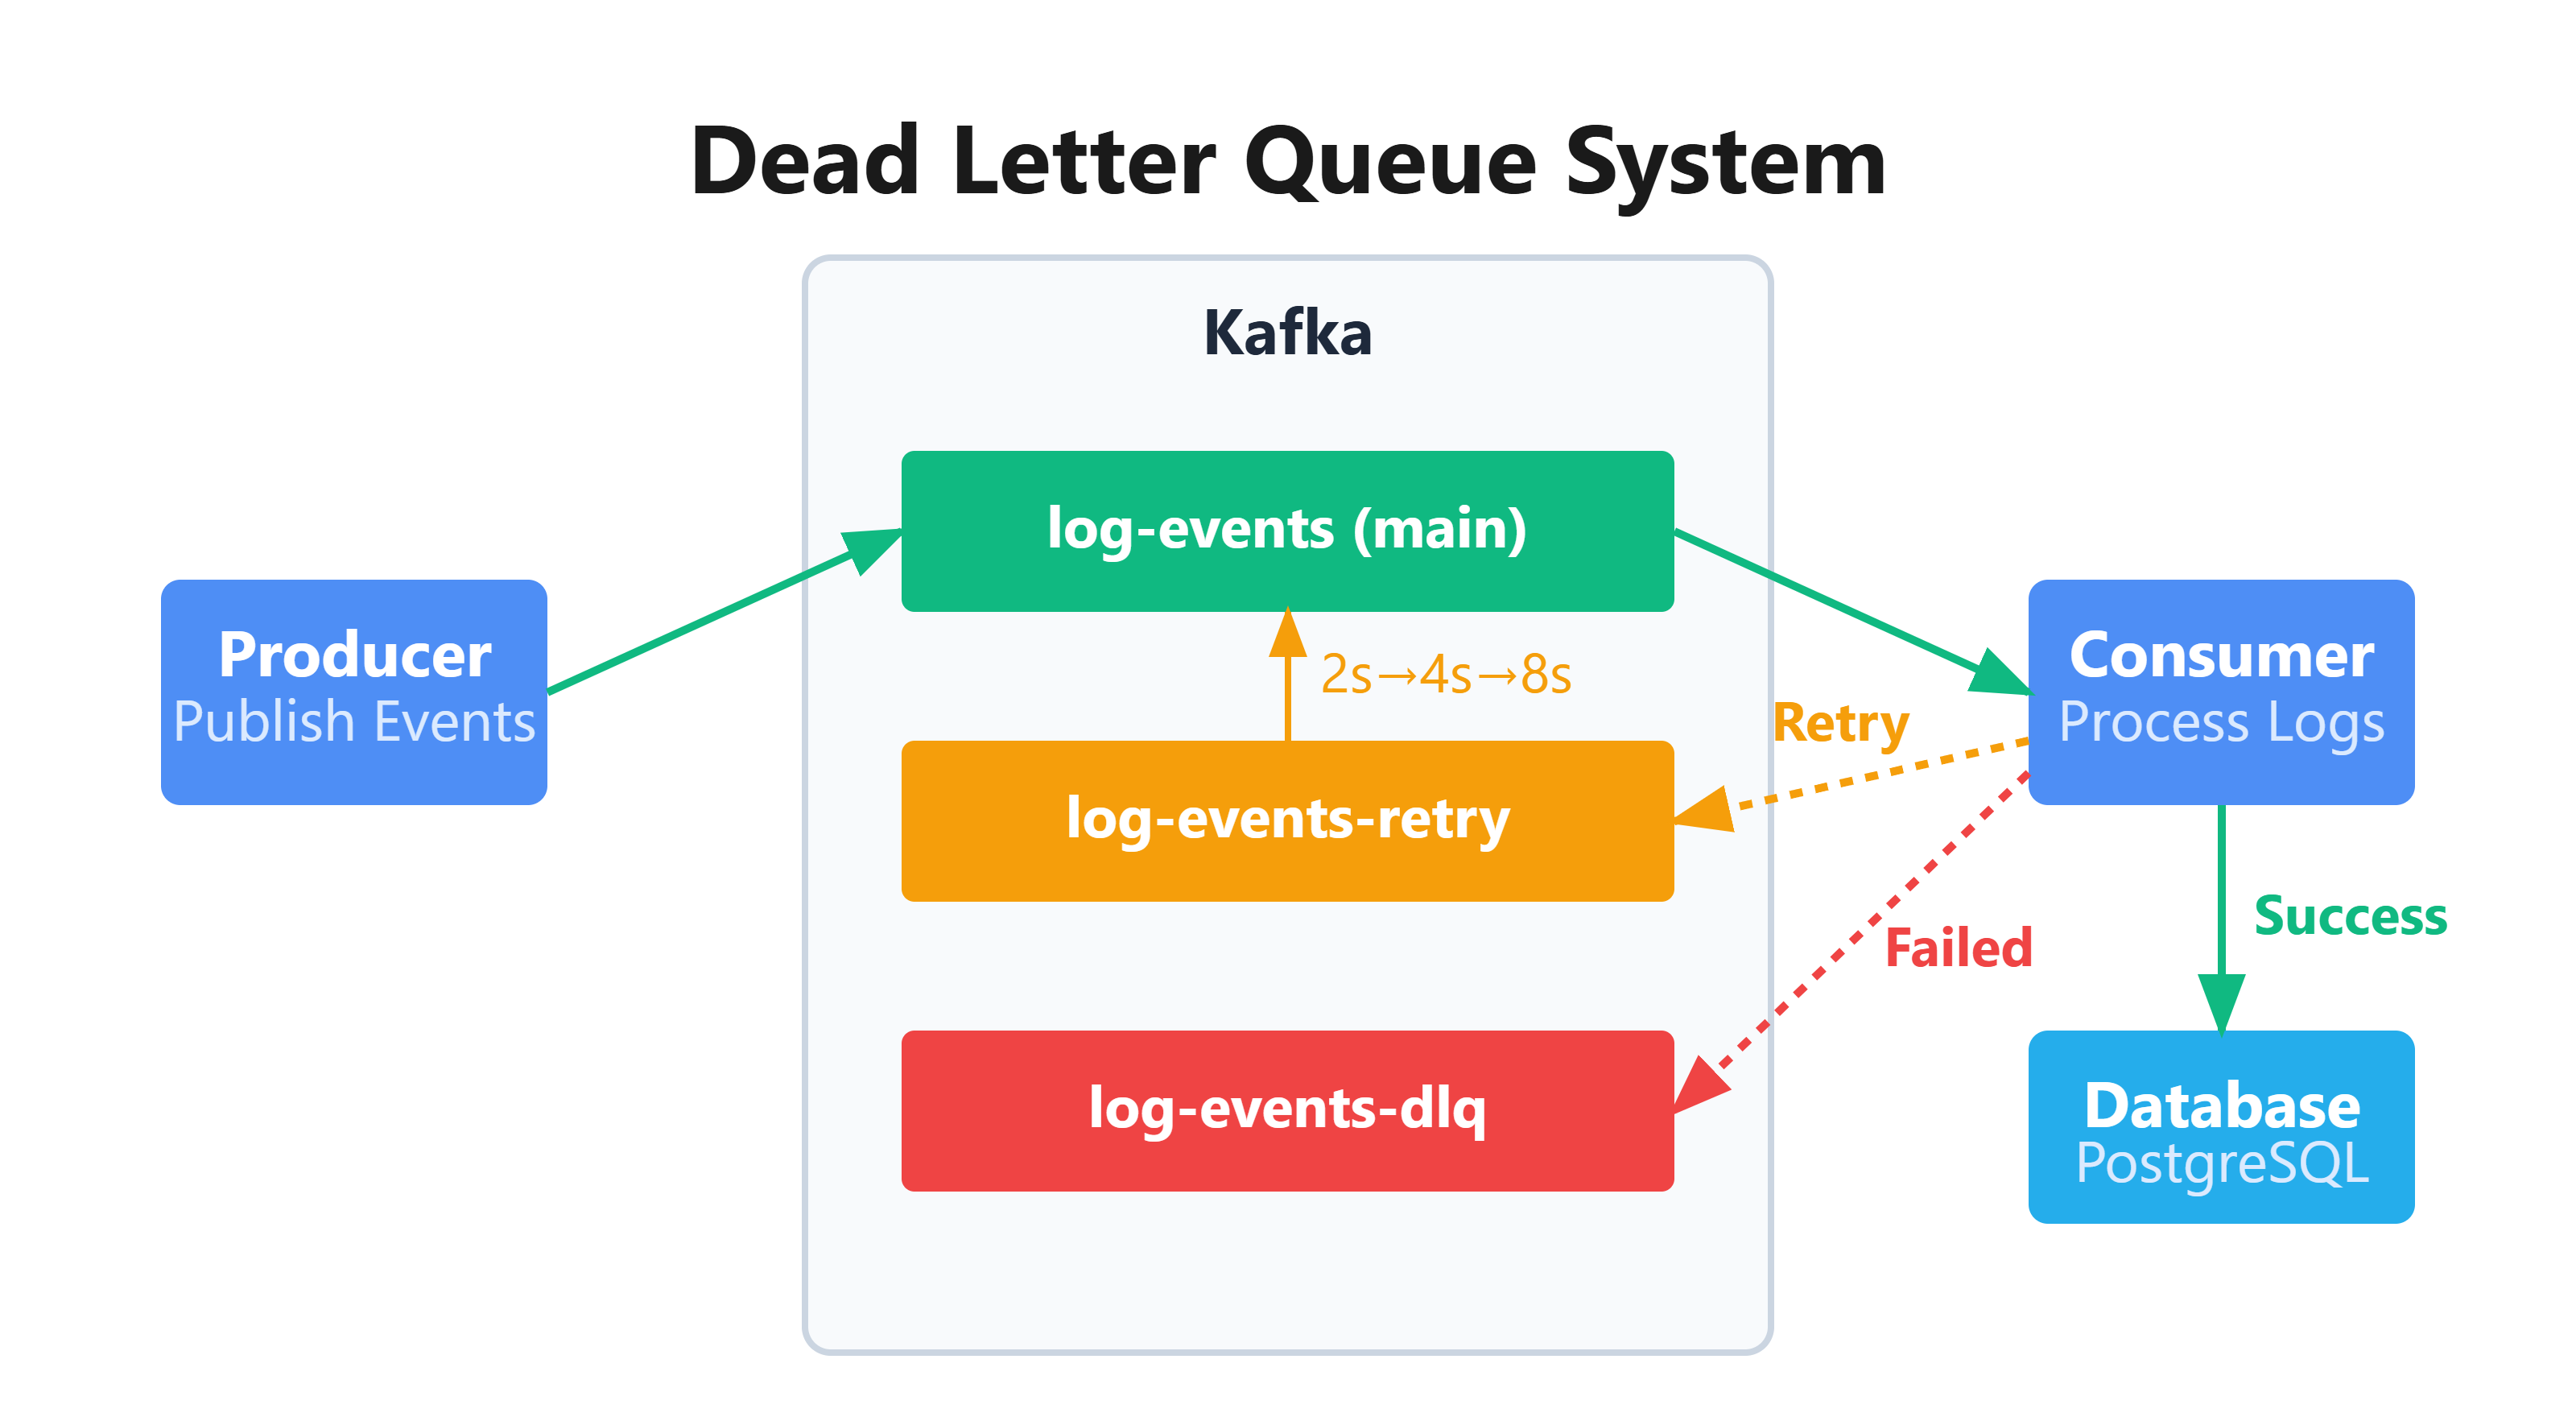
Why This Matters: The Hidden Cost of Message Failures
When Uber processes 15 billion location updates daily, even a 0.01% failure rate means 1.5 million lost events. Without dead letter queues, these failures cascade: poison messages block consumer threads, retries amplify database load, and critical data vanishes silently. Netflix discovered this during a payment processing incident where failed transactions entered retry loops, creating 50x database load that took down their entire billing system for 3 hours.
Dead letter queues solve three production-critical problems: they prevent poison messages from blocking healthy traffic, preserve failed events for forensic analysis, and enable controlled reprocessing without impacting live systems. Amazon’s order processing uses DLQs to quarantine corrupted events that would otherwise trigger cascading failures across inventory, payment, and shipping services.
System Design Deep Dive
Pattern 1: Dead Letter Exchange with Message TTL
The foundation of DLQ architecture combines message expiration with automatic rerouting. When a consumer fails to process a message after exhausting retries, Kafka routes it to a dedicated dead letter topic rather than discarding it. This pattern preserves message ordering guarantees while preventing head-of-line blocking.
Trade-off Analysis: Immediate DLQ routing reduces consumer latency but may discard recoverable failures. Delayed routing with exponential backoff (1s, 2s, 4s, 8s) handles transient errors but increases system complexity. Production systems typically use hybrid approaches: fast-fail for validation errors, delayed retry for network timeouts.
Scalability Bottleneck: DLQs can become write-heavy during cascading failures. A database outage causing 10,000 msg/sec to fail creates a DLQ spike that overwhelms monitoring systems. Solution: Rate-limit DLQ writes and aggregate failure metrics.
Pattern 2: Poison Message Detection
Poison messages—events that consistently fail processing despite retries—create infinite loops that waste resources. Detection requires tracking per-message failure counts and identifying retry patterns. The pattern: attach metadata (attempt_count, first_failure_timestamp, error_signature) to each message, increment counters on failure, and route to DLQ after threshold breach.
Critical Insight: Hash-based error signatures prevent different exceptions from counting toward the same threshold. A message failing with “DatabaseTimeout” then “ValidationError” represents two distinct failure modes requiring separate analysis. Netflix uses error signature clustering to identify systemic issues vs. data-specific problems.
Anti-pattern: Global retry counters that reset on consumer restart. This creates a vulnerability where poison messages repeatedly block processing after each deployment. Solution: Store retry state in persistent headers, not consumer memory.
Pattern 3: Graduated Retry Strategy
Not all failures are equal. Network timeouts justify aggressive retries; schema validation errors don’t. Graduated retry implements failure classification: transient errors (network, rate limits) get exponential backoff up to 10 attempts, permanent errors (validation, authorization) go straight to DLQ, and ambiguous errors (generic exceptions) get limited retries.
Implementation Complexity: Distinguishing transient from permanent failures requires exception taxonomy. Spring Boot’s @Retryable annotation supports this but needs careful configuration. The challenge: third-party library exceptions that don’t clearly indicate failure type.
Production Example: Uber’s trip processing retries location errors (GPS drift, network issues) but immediately DLQs invalid passenger IDs. This prevents wasting resources on unrecoverable errors while maximizing success rate for transient issues.
Pattern 4: DLQ Monitoring and Alerting
Effective DLQ systems require real-time visibility into failure patterns. Key metrics: DLQ ingestion rate (msgs/sec), failure type distribution (validation vs. timeout vs. business logic), message age in DLQ, and reprocessing success rate. Alerts trigger when: DLQ rate exceeds 5% of main topic volume, any single error type dominates (>50% of failures), or messages remain in DLQ beyond retention policy.
Observability Challenge: Correlating DLQ messages back to original requests for distributed tracing. Solution: Preserve correlation IDs through the entire retry chain, enabling reconstruction of the complete processing timeline.
Alert Fatigue Prevention: Aggregate similar failures into single alerts rather than individual message notifications. A schema change causing 1000 validation failures should generate one “schema mismatch” alert, not 1000.
Pattern 5: Controlled Reprocessing Pipeline
Dead letter queues aren’t graveyards—they’re holding areas for recovery. Reprocessing requires: manual inspection tools for root cause analysis, fix-and-replay mechanisms for code bugs, and automated recovery for transient failures that resolved. The pattern uses a separate reprocessing consumer that reads from DLQ at controlled rates, applies fixes/transformations, and publishes to original topic.
Consistency Consideration: Reprocessed messages may arrive out-of-order relative to newer events. For log processing, this is acceptable (logs are idempotent). For financial transactions, it’s catastrophic. Solution: Timestamp-based deduplication and order verification before committing reprocessed events.
Capacity Planning: Reprocessing after major incidents can create thundering herd. If 100,000 messages accumulated during a database outage, naive replay at full speed overwhelms the now-healthy database. Solution: Rate-limited replay with circuit breakers.
Github Link:
https://github.com/sysdr/sdc-java/tree/main/day36/dlq-log-systemImplementation Walkthrough
Core Architecture
Our implementation creates three Kafka topics: log-events (main processing), log-events-retry (temporary retry holding), and log-events-dlq (permanent failures). The consumer uses Spring Kafka’s error handler with custom retry logic that routes messages through this topology.
Step 1: Enhanced Consumer with Retry Semantics
The LogConsumerService adds retry metadata to message headers before reprocessing. Each failure increments retry-count, records error-type, and timestamps the failure. After 3 attempts (configurable), messages route to DLQ with full diagnostic context. This design ensures forensic data survives through the failure chain.
Architectural Decision: We use Kafka headers for retry state rather than external storage (Redis/database) because headers travel with the message, preventing state synchronization issues during consumer scaling or rebalancing.
Step 2: DLQ Producer with Classification
The DeadLetterQueueService receives failed messages and classifies them by error type: VALIDATION, TIMEOUT, PROCESSING, UNKNOWN. Classification drives alerting and reprocessing strategies. Validation errors likely need code fixes, timeouts might self-resolve, processing errors require case-by-case analysis.
Implementation Detail: Error classification uses pattern matching on exception stack traces. This is brittle but pragmatic—proper exception hierarchies across microservices is ideal but rarely achievable in practice.
Step 3: Monitoring Integration
Micrometer counters track DLQ metrics by error type: dlq.messages.total{type=VALIDATION}, dlq.messages.total{type=TIMEOUT}. Prometheus scrapes these and Grafana dashboards visualize failure patterns. We also emit custom metrics for average time-to-DLQ (how quickly failures are detected) and DLQ processing lag (how far behind the reprocessing consumer is).
Step 4: Reprocessing API
The API Gateway exposes endpoints for DLQ operations: list failed messages with filters, inspect individual message details including full payload and error history, manually trigger reprocessing with optional transformations, and bulk replay with rate limiting. This transforms DLQ from black hole to operational tool.
Testing Failure Scenarios
The integration test suite simulates production failure modes: poison messages with invalid JSON, database timeouts during peak load, network partitions during message processing, and schema evolution mismatches. Each test verifies that messages reach DLQ with correct classification and that retries respect exponential backoff timings.
Load Test Design: We inject 1% failure rate into 10,000 msg/sec load to validate that DLQ handling doesn’t impact healthy message throughput. Success criteria: main topic latency remains under 100ms p99 despite DLQ activity.
Working Code Demo:
Production Considerations
Performance Profile: DLQ operations add 2-5ms latency per failed message (header writes, topic routing). At 0.1% failure rate (100 failures/sec in a 100K msg/sec system), DLQ overhead is negligible. But during cascading failures, DLQ writes can spike to 50K msg/sec, requiring dedicated partitions and consumer groups.
Monitoring Strategy: Alert on DLQ rate > 5% of main topic volume (indicates systemic issue), messages in DLQ older than 24 hours (retention violation), reprocessing success rate < 80% (fix-and-replay not working), and DLQ consumer lag growing (reprocessing falling behind).
Failure Mode: DLQ itself can fail. When DLQ topic is unavailable, consumers must decide: drop messages (data loss), block processing (availability loss), or buffer locally (memory exhaustion). Our implementation uses local disk buffering with size limits, preferring temporary degradation over silent data loss.
Capacity Planning: Size DLQ topic for 10x average failure rate to handle spike scenarios. If normal failure rate is 100 msg/sec, provision DLQ for 1000 msg/sec sustained. DLQ retention should match investigation SLAs—24 hours minimum, 7 days recommended.
Connection to Scale: FAANG DLQ Patterns
Netflix’s payment processing uses multi-tier DLQs: immediate DLQ for validation errors, 3-hour delayed queue for transient failures, 24-hour manual review queue for business logic errors. This graduated approach maximizes automatic recovery while minimizing human intervention. Their DLQ dashboards show real-time failure taxonomy, enabling rapid incident response.
Amazon’s order processing DLQs preserve idempotency keys and business context, allowing customer service to manually retry failed orders without duplicate charges. During Black Friday, their DLQ systems capture millions of failures without impacting checkout latency, then automatically reprocess overnight as infrastructure stabilizes.
Next Steps
Tomorrow we implement priority queues, enabling critical logs to bypass normal processing delays and reach consumers within milliseconds.