

Day 35: Topic-Based Routing - Building Multi-Pipeline Log Processing Systems
What We’re Building Today
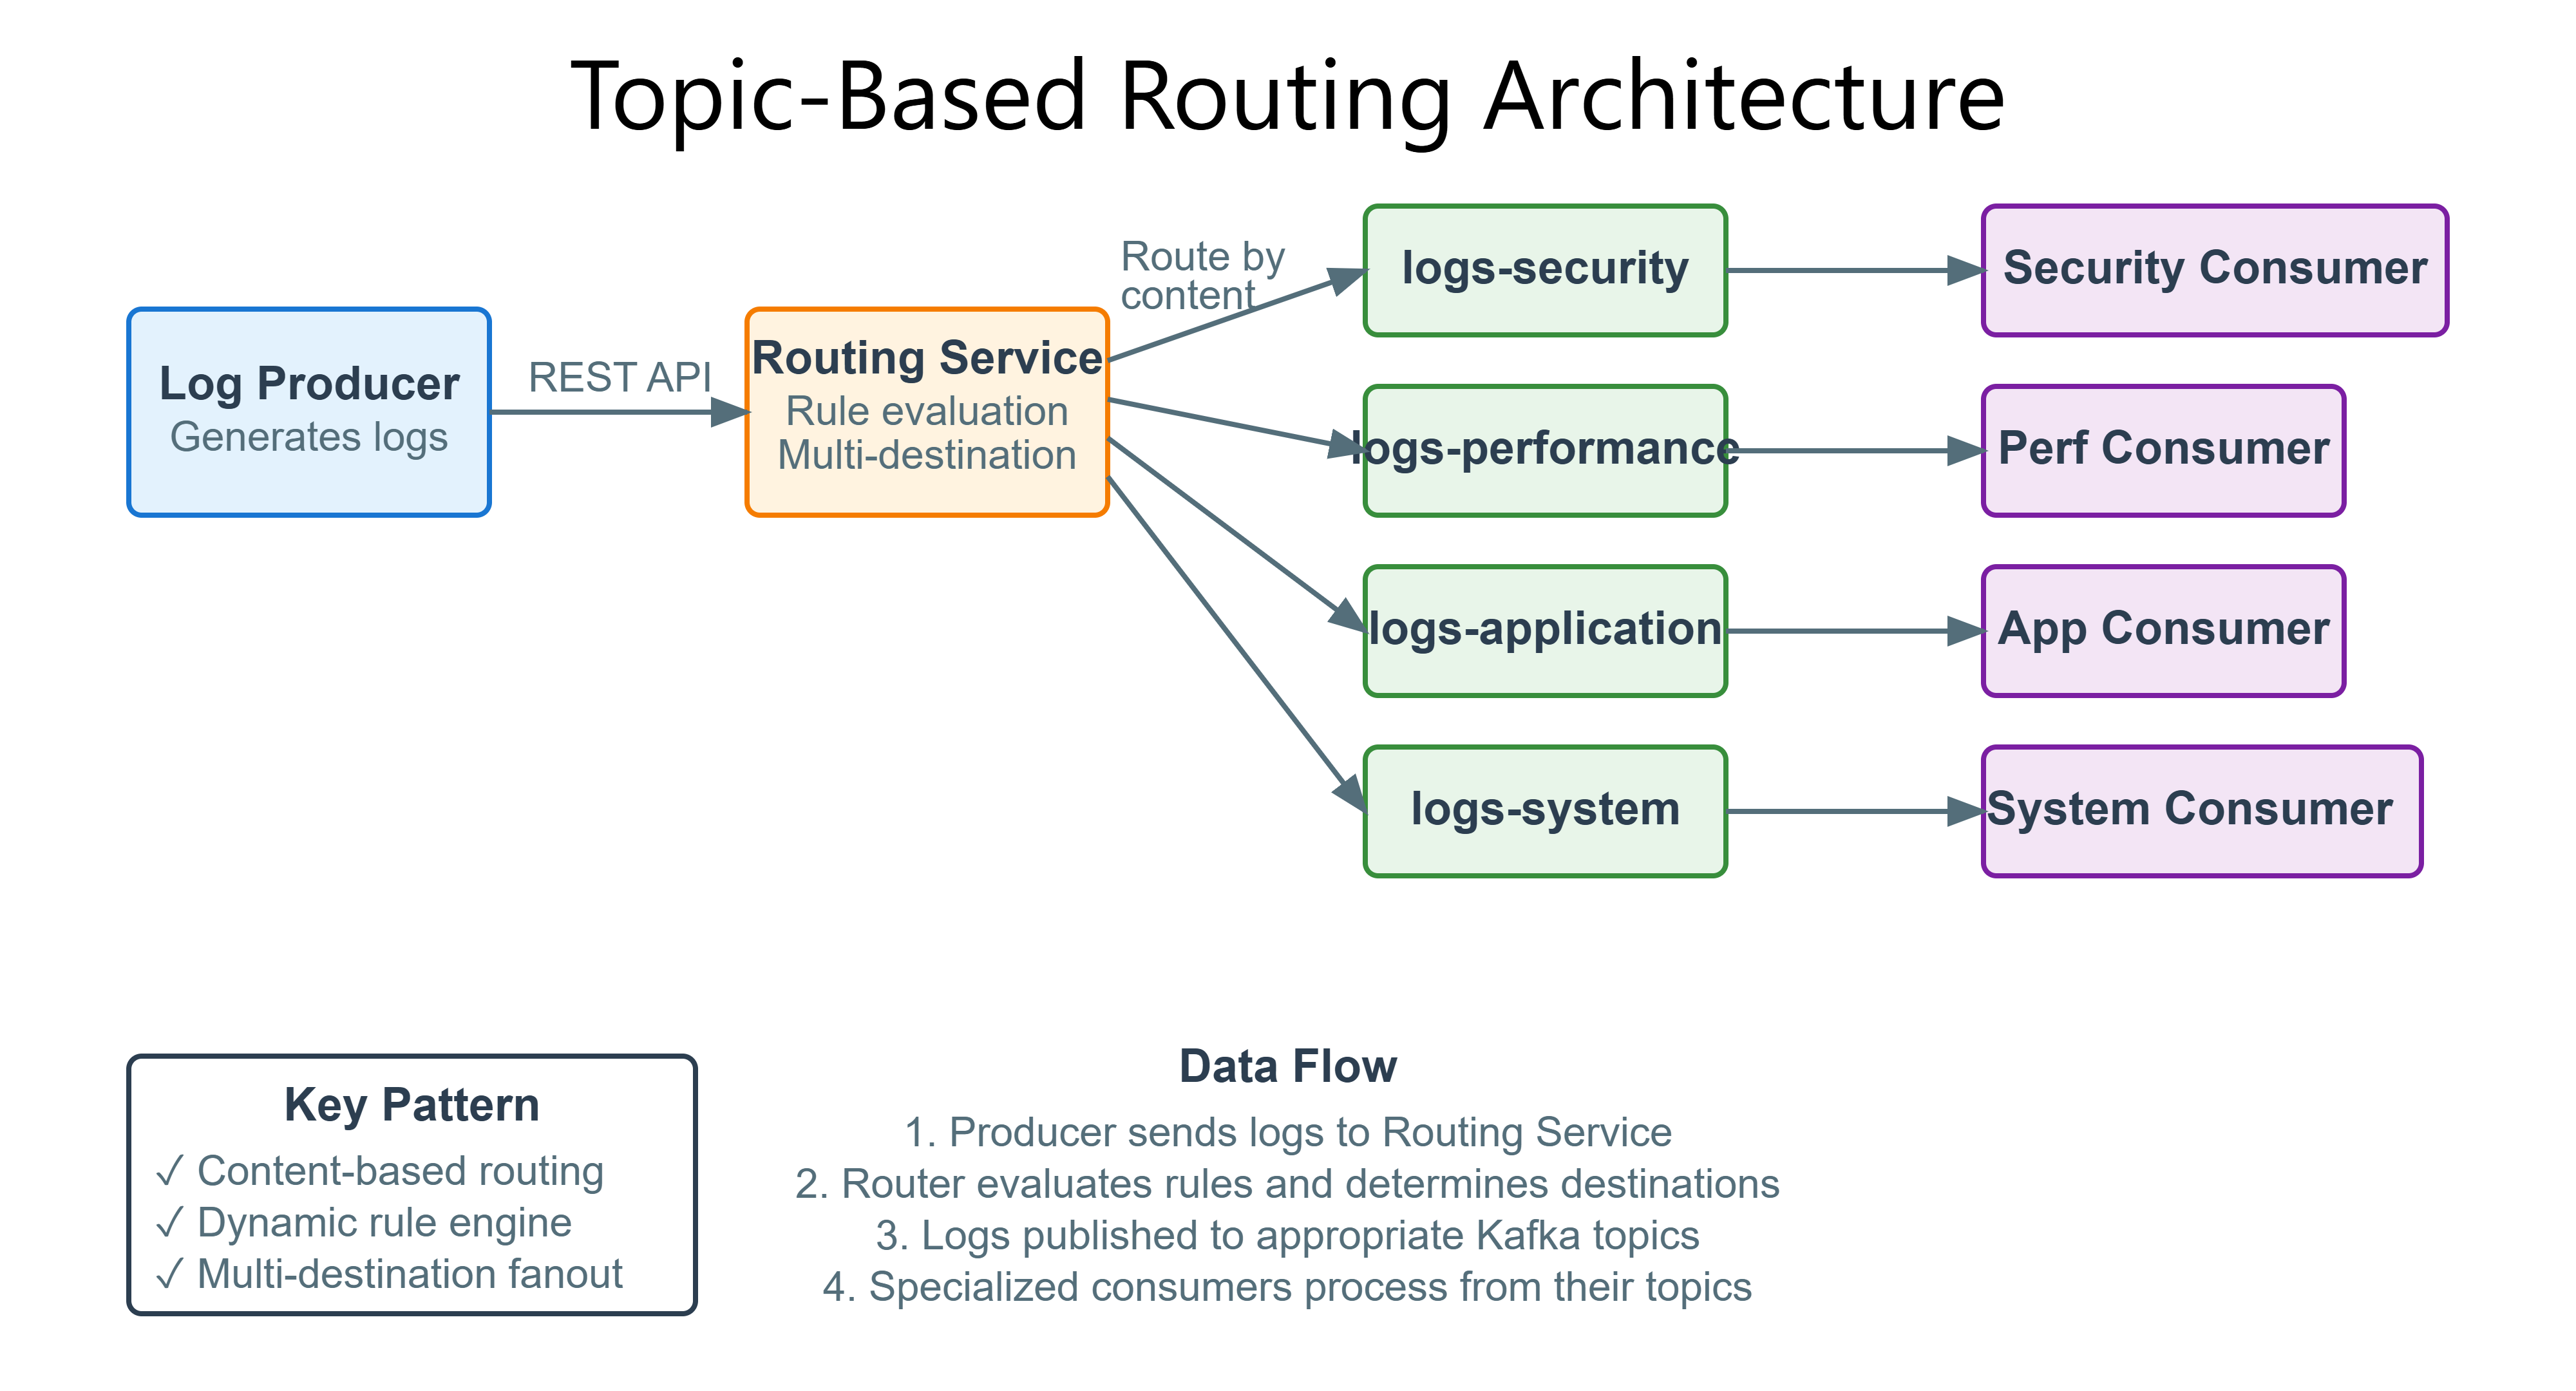
Today we implement intelligent routing mechanisms that direct different log types to specialized processing pipelines:
Content-based routing engine that inspects log attributes and routes to appropriate Kafka topics
Multiple specialized consumer pipelines (security, performance, application, system logs)
Dynamic routing rules supporting regex patterns and severity-based filtering
Fanout patterns for logs requiring multiple processing paths simultaneously
Why This Matters: The Routing Challenge at Scale
When Uber processes 100 billion log events daily, they don’t send every log through the same pipeline. Security incidents need immediate alerting within milliseconds, performance metrics aggregate into time-series databases, application errors route to incident tracking systems, and audit logs archive to long-term storage. Each pipeline has different latency requirements, storage patterns, and processing logic.
Without intelligent routing, you face two critical problems: resource waste (processing irrelevant logs consumes compute unnecessarily) and latency inflation (high-priority security events queue behind low-priority debug logs). Netflix learned this lesson during a critical security incident when P0 alerts drowned in millions of debug logs, delaying detection by 18 minutes. Their solution? Topic-based routing that isolated security logs into dedicated high-priority pipelines.
The architectural challenge isn’t just filtering - it’s building routing logic that scales to millions of events per second while maintaining low latency, supports dynamic rule updates without deployment, and handles the fanout complexity when single events need multiple processing paths.
System Design Deep Dive
Pattern 1: Content-Based Routing with Topic Segmentation
Traditional log processing systems use a single queue, creating head-of-line blocking where high-priority logs wait behind low-priority ones. Topic-based routing solves this by inspecting message content and directing to specialized topics.
Architecture Decision: Use Kafka topic segmentation rather than application-level filtering. When a log arrives, the routing service examines attributes (severity, source, type) and publishes to specific topics: logs-security, logs-performance, logs-application, logs-system. Each topic has independent consumer groups with different processing characteristics.
Trade-off Analysis: Content inspection adds 2-3ms latency at the router. However, specialized pipelines reduce downstream processing time by 10-100x by eliminating irrelevant log filtering at each consumer. For high-throughput systems (>10K events/sec), the routing overhead is negligible compared to gains from targeted processing.
Failure Mode: Routing logic bugs can silently drop critical logs. Mitigation: implement a catch-all default topic and monitor routing decision metrics. If 90% of logs route to default, your routing rules are failing.
Pattern 2: Dynamic Routing Rules Engine
Hard-coded routing logic requires deployment for rule changes. Production systems need runtime rule updates for emergency response (route all logs from compromised service to security pipeline immediately).
Implementation: Store routing rules in Redis with pattern matching using regex and composite conditions. Router loads rules at startup and subscribes to Redis pub/sub for updates. Each rule defines: match pattern (source service, severity level, contains keyword), destination topic, priority (when multiple rules match).
Rule Example:
- Pattern: severity=ERROR AND service=payment-api
- Destination: logs-critical-business
- Priority: 1 (highest)
Scalability Consideration: Pattern matching is CPU-intensive. At 50K events/sec, regex evaluation can become the bottleneck. Solution: compile regex patterns once at rule load, use simple string comparisons for common cases (severity levels), and implement rule caching for repeated patterns.
Pattern 3: Multi-Destination Fanout
Some logs need multiple processing paths simultaneously. Security logs might need real-time alerting AND compliance archival AND audit trail storage. Single-destination routing creates duplication complexity.
Kafka Approach: Publish to multiple topics atomically. The routing service evaluates all rules, collects matching destinations, and sends the log to each topic in a single transaction. Kafka’s producer batching optimizes multi-topic writes.
Critical Implementation Detail: Use Kafka transactions to ensure all-or-nothing delivery. If routing to 3 topics, either all 3 succeed or none do. Partial failures create data inconsistency across pipelines.
CAP Theorem Implication: Fanout increases write latency (waiting for multiple topic acks). For 3-way fanout with min.insync.replicas=2, you need 6 broker acknowledgments. This favors consistency over latency. For latency-critical paths, consider async fanout with best-effort delivery to secondary topics.
Pattern 4: Priority-Based Topic Allocation
Not all logs are equal. Security incidents need immediate processing; debug logs can tolerate delays. Separate topics enable independent consumer scaling and resource allocation.
Resource Mapping:
logs-critical: 16 partitions, 8 consumer instances, dedicated CPU/memorylogs-high: 12 partitions, 4 consumer instanceslogs-medium: 8 partitions, 2 consumer instanceslogs-low: 4 partitions, 1 consumer instance
Auto-Scaling Strategy: Monitor consumer lag per topic. When logs-critical lag exceeds 100 messages, scale consumers within 30 seconds. Low-priority topics can tolerate minutes of lag before scaling.
Back-Pressure Handling: When downstream processing can’t keep up, routing logic can implement adaptive throttling - temporarily route low-priority logs to batch processing while maintaining real-time flow for critical logs.
Pattern 5: Routing Metrics and Observability
Routing decisions are invisible in single-queue systems. Topic-based routing enables granular observability: how many logs per source service, severity distribution per topic, routing rule hit rates, and misrouted log detection.
Key Metrics:
Routing decision latency (p50, p99, p999)
Logs per topic per second (detect anomalies)
Rule match rate (identify unused rules)
Default topic rate (detect routing failures)
Alerting Strategy: If >5% of logs route to default topic, routing logic is failing. If critical topic receives >10x normal rate, investigate potential security incident or service failure. If routing latency p99 exceeds 10ms, router is becoming bottleneck.
Github Link:
https://github.com/sysdr/sdc-java/tree/main/day35/log-routing-systemImplementation Walkthrough
Routing Service Architecture
The routing service sits between log producers and Kafka topics. It receives logs via REST API, evaluates routing rules, and publishes to appropriate topics.
Core Components:
REST Controller: Accepts log events, validates format, returns 202 Accepted immediately
Routing Engine: Evaluates rules from Redis cache, determines destination topics
Kafka Producer: Publishes to multiple topics with transaction support
Rule Manager: Loads rules at startup, subscribes to Redis updates, recompiles patterns
Implementation Flow:
1. Log arrives at POST /api/logs
2. Validate JSON structure (reject invalid immediately)
3. Evaluate routing rules in priority order
4. Collect all matching destinations (fanout)
5. Begin Kafka transaction
6. Publish to each destination topic
7. Commit transaction (all-or-nothing)
8. Return 202 to client
9. Record routing metrics
Consumer Pipeline Specialization
Each topic has dedicated consumers optimized for their log type:
Security Pipeline (logs-security):
Real-time processing (no batching)
Immediate alerting to PagerDuty
Enrichment with threat intelligence
Storage in security SIEM
Performance Pipeline (logs-performance):
Batched aggregation (10-second windows)
Time-series database writes
Percentile calculation
Grafana dashboard updates
Application Pipeline (logs-application):
Error tracking integration
Stack trace analysis
User session correlation
Ticket creation for errors
Configuration-Driven Routing Rules
Rules defined in YAML, loaded to Redis:
rules:
  - name: security-critical
    priority: 1
    conditions:
      severity: [ERROR, FATAL]
      source: [auth-service, payment-api]
    destinations: [logs-security, logs-critical]

  - name: performance-metrics
    priority: 2
    conditions:
      type: metric
      metric_name: "response_time_*"
    destinations: [logs-performance]
The rule manager compiles these into efficient matching logic, caching compiled patterns for reuse.
Working Code Demo:
Production Considerations
Performance Characteristics: Routing adds 2-3ms p50 latency, 5-8ms p99. For 50K events/sec, router needs 4-8 cores with rule caching. Kafka producer batching reduces per-message overhead to <100μs.
Failure Scenarios:
Rule compilation failure: Fall back to default routing, alert ops team
Kafka topic unavailable: Queue in Redis with TTL, retry with backoff
Transaction timeout: Reduce fanout destinations, implement async fallback
Redis connection loss: Use last-known-good rule cache, alert for manual intervention
Monitoring Requirements:
Track routing decision latency (should be <5ms p99)
Monitor logs per topic per second (detect anomalies)
Alert on default topic rate spikes (routing failures)
Track transaction abort rate (downstream capacity issues)
Consumer lag per topic (identify processing bottlenecks)
Capacity Planning: Each router instance handles 10-15K events/sec. For 100K events/sec, deploy 8-10 router instances behind load balancer. Each Kafka topic needs partitions equal to max consumer count for horizontal scaling.
Scale Connection: Enterprise Routing at FAANG
Netflix routes 500K events/sec across 50+ specialized topics. Their routing engine uses multi-stage filtering: cheap checks first (severity string comparison), expensive checks last (regex pattern matching). They implement circuit breakers per topic - if security topic consumers are down, route security logs to backup archival topic to prevent data loss.
Amazon’s CloudWatch Logs uses hierarchical routing with namespace isolation. Each AWS service has dedicated topic namespaces, enabling independent scaling and preventing noisy neighbor problems. Their routing SLA: 99.99% of logs routed correctly within 10ms.
Next Steps
Tomorrow we implement dead letter queues for handling logs that fail processing despite retries, completing our fault-tolerance architecture.