The Hidden Performance Bottlenecks That Kill Production Systems
254-Day Hands-On System Design Series 📊
Building Production-Ready Distributed Log Processing Systems
Module 1: Foundations of Log Processing | Week 4: Distributed Log Storage
Welcome back to our distributed log processing journey! Yesterday, we built anti-entropy mechanisms to keep our cluster consistent. Today, we're diving into something equally critical but often overlooked until it's too late: cluster performance monitoring and optimization.
Picture this: your distributed log storage cluster is humming along, processing thousands of log entries per second. Everything seems fine until suddenly, response times spike from 50ms to 5 seconds. Users start complaining, alerts fire, and you're scrambling to figure out what went wrong. This scenario plays out in production systems every day, and the root cause is almost always the same: inadequate performance monitoring.
Why Performance Monitoring Matters More Than You Think
In distributed systems, performance issues rarely announce themselves with obvious error messages. Instead, they manifest as subtle degradations that compound across your cluster nodes. A slight increase in disk I/O latency on one node can cascade into cluster-wide slowdowns. Network congestion between nodes can cause replication lag, leading to inconsistent reads and failed writes.
The challenge with distributed log processing systems is that performance bottlenecks can emerge at multiple layers simultaneously. Your application might be generating logs faster than your storage layer can persist them. Your network might be saturated with replication traffic. Your disk subsystem might be overwhelmed with both reads and writes. Without proper monitoring, you're flying blind.
💡 Industry Insight: Netflix processes over 500 billion events daily across their distributed systems. Their engineering teams attribute 60% of their system reliability to comprehensive performance monitoring that detects issues before they impact users.
Understanding the Performance Landscape
Performance monitoring in distributed log storage involves tracking four critical dimensions: throughput, latency, resource utilization, and cluster health. Each dimension tells a different part of the story.
Throughput measures how many log entries your cluster processes per second. This metric reveals your system's capacity limits and helps you understand when scaling becomes necessary. However, throughput alone can be misleading. A system might maintain high throughput while latency degrades significantly.
Latency captures the time between when a log entry arrives and when it's successfully stored and replicated. In distributed systems, we track multiple latency types: write latency (time to acknowledge a write), read latency (time to retrieve a log entry), and replication latency (time for data to propagate across replicas).
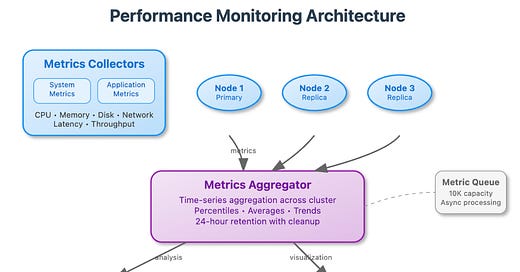
Resource utilization encompasses CPU usage, memory consumption, disk I/O patterns, and network bandwidth across all cluster nodes. These metrics help identify which resources are becoming constrained and where optimization efforts should focus.
Cluster health includes node availability, partition status, and replication consistency. These metrics ensure your performance optimizations don't compromise system reliability.
The Architecture of Performance Monitoring
[📊 COMPONENT ARCHITECTURE DIAGRAM ]


