

Day 3: Creating a Simple Log Collector Service
254-Day Distributed Log Processing System Implementation

Week 1: Setting Up the Infrastructure
Introduction: What Are We Building Today?
Today, we're creating a log collector service that watches local log files and detects new entries. This service builds upon yesterday's log generator and represents a critical component in our distributed log processing system.
Imagine you're a detective monitoring surveillance cameras across a city. You can't watch all cameras simultaneously, so you need a system that automatically alerts you when something important happens. Our log collector works similarly – it continuously watches log files and notifies the system when new information appears.
Why This Matters in Distributed Systems
In real-world distributed systems, logs are the lifeline for understanding what's happening across multiple services. Companies like Netflix, Amazon, and Google collect billions of log entries daily to:
Identify system failures before they affect users
Track suspicious activities for security purposes
Monitor performance to prevent slowdowns
Troubleshoot issues when they occur
The log collector is often the first step in a log pipeline that eventually feeds data to dashboards, alerts, and analytics systems that engineers rely on daily.
Where This Fits in Our Overall System
Let's understand where our log collector fits:
Log Generator (Yesterday's component): Creates log entries
Log Collector (Today's component): Watches and captures new log entries
Log Processor (Future component): Analyzes and transforms logs
Log Storage (Future component): Saves processed logs
Log Query Engine (Future component): Allows searching logs
Our collector is the bridge between log generation and processing, ensuring no valuable information gets missed.
How It Fits Into Our Overall System
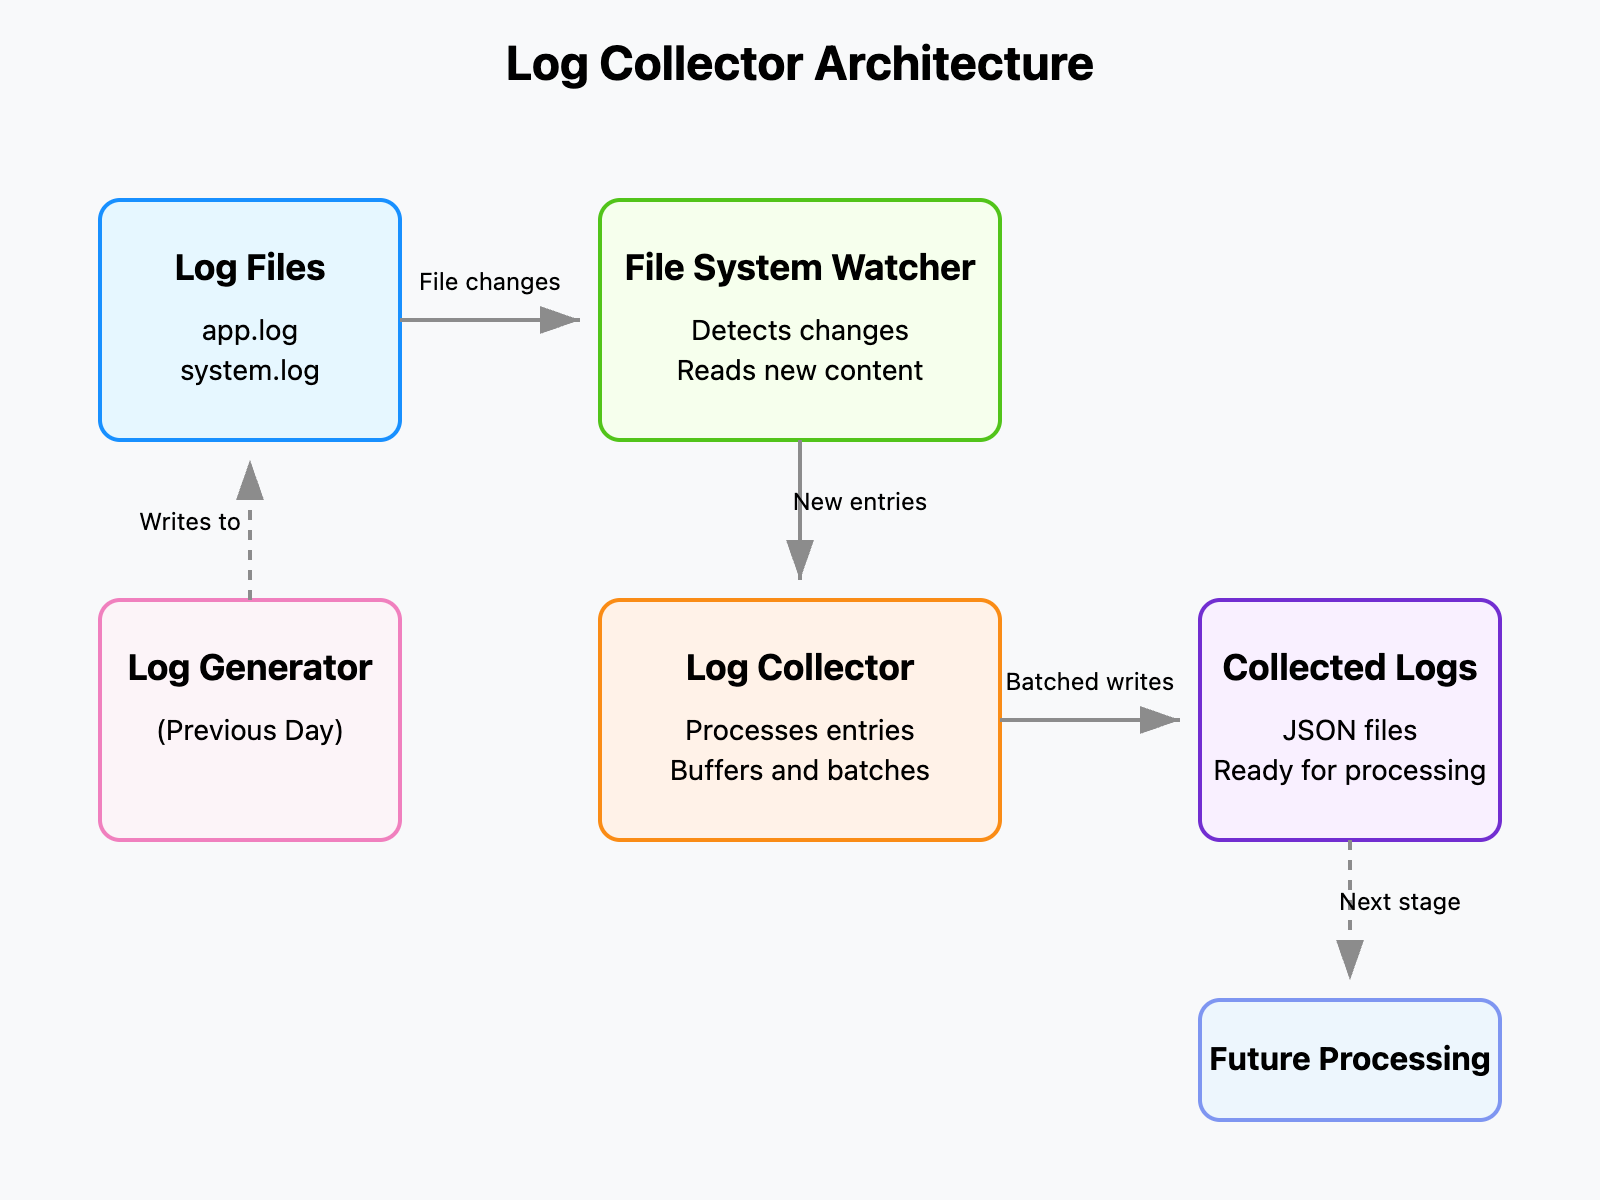
Yesterday, we built a log generator. Today's collector will watch those logs, detect new entries, and prepare them for the next stage of processing. This component acts as the "gathering" stage in our data pipeline, solving the problem of how to detect and capture constantly changing information.
Implementation: Building Our Log Collector
Let's create a service that:
Watches specified log files
Detects when new entries appear
Captures those entries for further processing
We'll use Python with the watchdog library to monitor file changes.
Let's create a simple but effective log collector service. We'll use Python for its simplicity and readability.
Step 1: Set Up the Project Structure
First, let's organize our project:
mkdir log-collector
cd log-collector
touch log_collector.py
touch Dockerfile
touch docker-compose.yml
touch requirements.txt
mkdir sample_logs
touch sample_logs/app.log
Step 2: Install Dependencies
In the requirements.txt file, add:
watchdog==2.1.9
pyyaml==6.0
The watchdog library will help us monitor file changes efficiently.
Step 3: Code the Log Collector
Let's implement our log collector in log_collector.py:

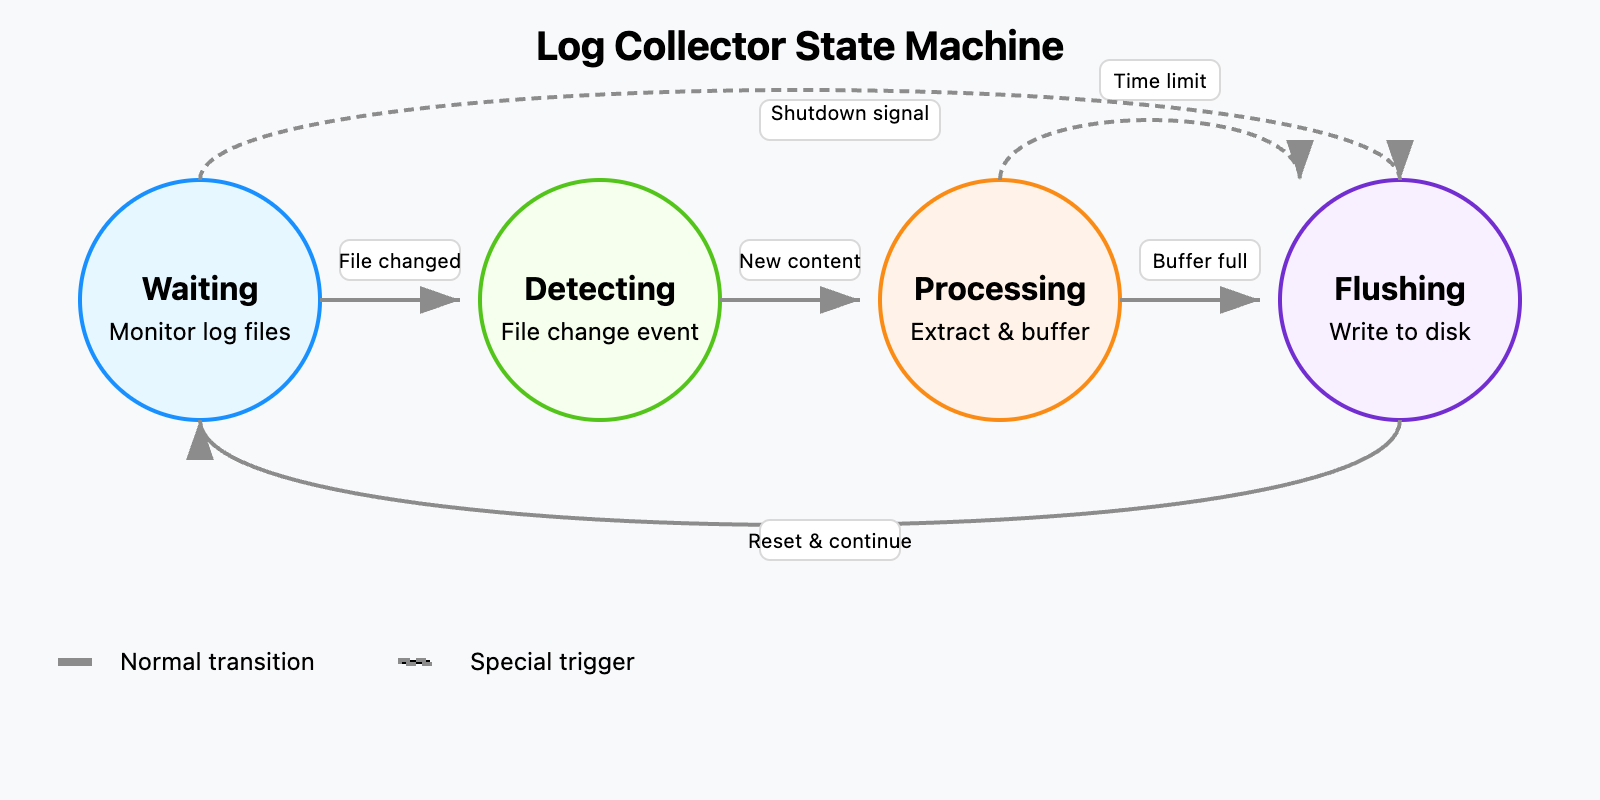
Log Collector State Machine
How to Run the Log Collector
Now that we understand the code, let's run our collector!
Local Setup
Install the required dependency:
pip install watchdogCreate a directory for collected logs:
mkdir collected_logsRun the collector (assuming you have a log file to watch):
python log_collector.py --log-files path/to/your/log_file.logDocker Setup
Build the Docker image:
docker build -t log-collector .Run the container:
docker run -v $(pwd)/logs:/app/logs -v $(pwd)/collected_logs:/app/collected_logs log-collector --log-files /app/logs/app.logDocker Compose (With Log Generator)
If you've completed yesterday's log generator, you can run both services together:
docker-compose up --buildThis will start both the log generator and collector services, with the collector watching the logs produced by the generator!
How It Works: Understanding the Code
Our log collector consists of several key components:
File System Watcher: Using the
watchdoglibrary, we monitor specified files for changes.Change Detection: When a file changes, we read only the new content since our last check.
Log Entry Processing: New content is parsed into structured log entries.
Buffering and Batch Processing: Entries are collected in a buffer, then written in batches for efficiency.
This approach is similar to tools like Fluentd, Logstash, and Filebeat, which are used in large-scale production systems.
Real-World Applications
Log collection is a critical component in many systems:
Web Services: Collecting and monitoring access logs and error logs
IoT Devices: Gathering sensor data from distributed devices
Security Systems: Detecting and analyzing unusual patterns
Application Monitoring: Tracking performance and errors
Companies like Netflix use distributed log collection to monitor tens of thousands of servers, helping them identify issues before they affect users.
Build This Today: Your Log Collection System
Assignment: Enhanced Log Collector
Task: Extend the basic log collector to handle multiple log formats and add basic filtering.
Steps:
Setup: Copy all files from today's lesson into a new directory.
Modify the Log Collector:
Add a simple regex-based filtering mechanism
Support at least two different log formats (e.g., plain text and JSON)
Implement a basic tagging system for categorizing log entries
Testing:
Create sample logs in different formats
Configure your collector to watch these logs
Verify entries are properly filtered and categorized
Expected Outcome:
A running log collector that can:
Monitor multiple files in real-time
Parse different log formats
Filter entries based on content
Tag entries for future processing
Write collected entries in a structured format
Advanced Challenge:
Add error reporting (e.g., count of parsing failures)
Implement log rotation detection
Add support for compressed log files
Success Criteria:
Your collector successfully detects new log entries in various formats
Filtered logs are correctly excluded
Entries are properly tagged
JSON output files contain well-structured data
Conclusion
Today, you've built a fundamental component of any distributed logging system – a real-time log collector. This service bridges the gap between log generation and processing, solving the critical problem of how to efficiently detect and capture constantly changing information.
In the next lesson, we'll explore how to process and analyze these collected logs, extracting valuable insights and patterns. By the end of this week, you'll have a complete end-to-end logging pipeline that demonstrates core distributed systems concepts!
Remember: Log collection might seem simple, but it's an essential foundation for more complex distributed applications. The principles you've learned today – monitoring for changes, efficient processing, and batched operations – apply broadly across distributed systems design.
Checking Docker Logs in Parallel
You can monitor logs from both the collector and generator containers in multiple ways:
Method 1: Using docker-compose logs
# View logs from all services together
docker-compose logs -f

# View logs from specific services
docker-compose logs -f log-collector log-generator
The -f flag follows the logs in real-time.
Method 2: Split terminal view
Open two terminal windows/panes
In the first terminal:
docker-compose logs -f log-generatorIn the second terminal:
docker-compose logs -f log-collectorMethod 3: Docker Desktop
If using Docker Desktop:
Open Docker Desktop
Go to the "Containers" tab
Select your running compose project
You can view logs for each service in separate tabs
Method 4: Log into containers
# Open a shell in the collector container
docker-compose exec log-collector sh

# Then view logs directly
tail -f /app/logs/app.log
You can use the same approach for the generator container to see runtime details beyond what's sent to stdout.