
Day 170: Implement User Journey Tracking
What We’re Building Today
Parse raw application logs to extract user events with session context
Build a journey stitcher that assembles per-user event sequences
Compute path frequency, drop-off rates, and average step durations
Expose a REST API serving journey analytics
Render an interactive Sankey-style flow diagram in the browser
Why This Matters
Every analytics team at Spotify, Airbnb, and LinkedIn tracks how users actually move through their product — not how designers hoped they would. The raw signal lives in your application logs: page views, clicks, API calls. The challenge is transforming those scattered events into coherent journeys and surfacing patterns at scale.
This lesson slots directly into your distributed log processing pipeline. Your log collector feeds events in; your journey tracker enriches them with session context and emits structured flow data downstream.
Core Concept: Session Stitching
A user journey is a time-ordered sequence of events belonging to one session. Stitching means grouping events by
user_id+session_id, sorting by timestamp, and collapsing consecutive duplicates.
Raw logs → [parse] → events → [stitch] → journeys → [aggregate] → flow graph
The hard part is session boundary detection: a new session starts when the idle gap between events exceeds a threshold (typically 30 minutes — same logic Google Analytics uses).
Preparing for a distributed systems interview?
→Download the free Interview Pack
→ Subscribe now to access source code repository - 200 + coding lessons
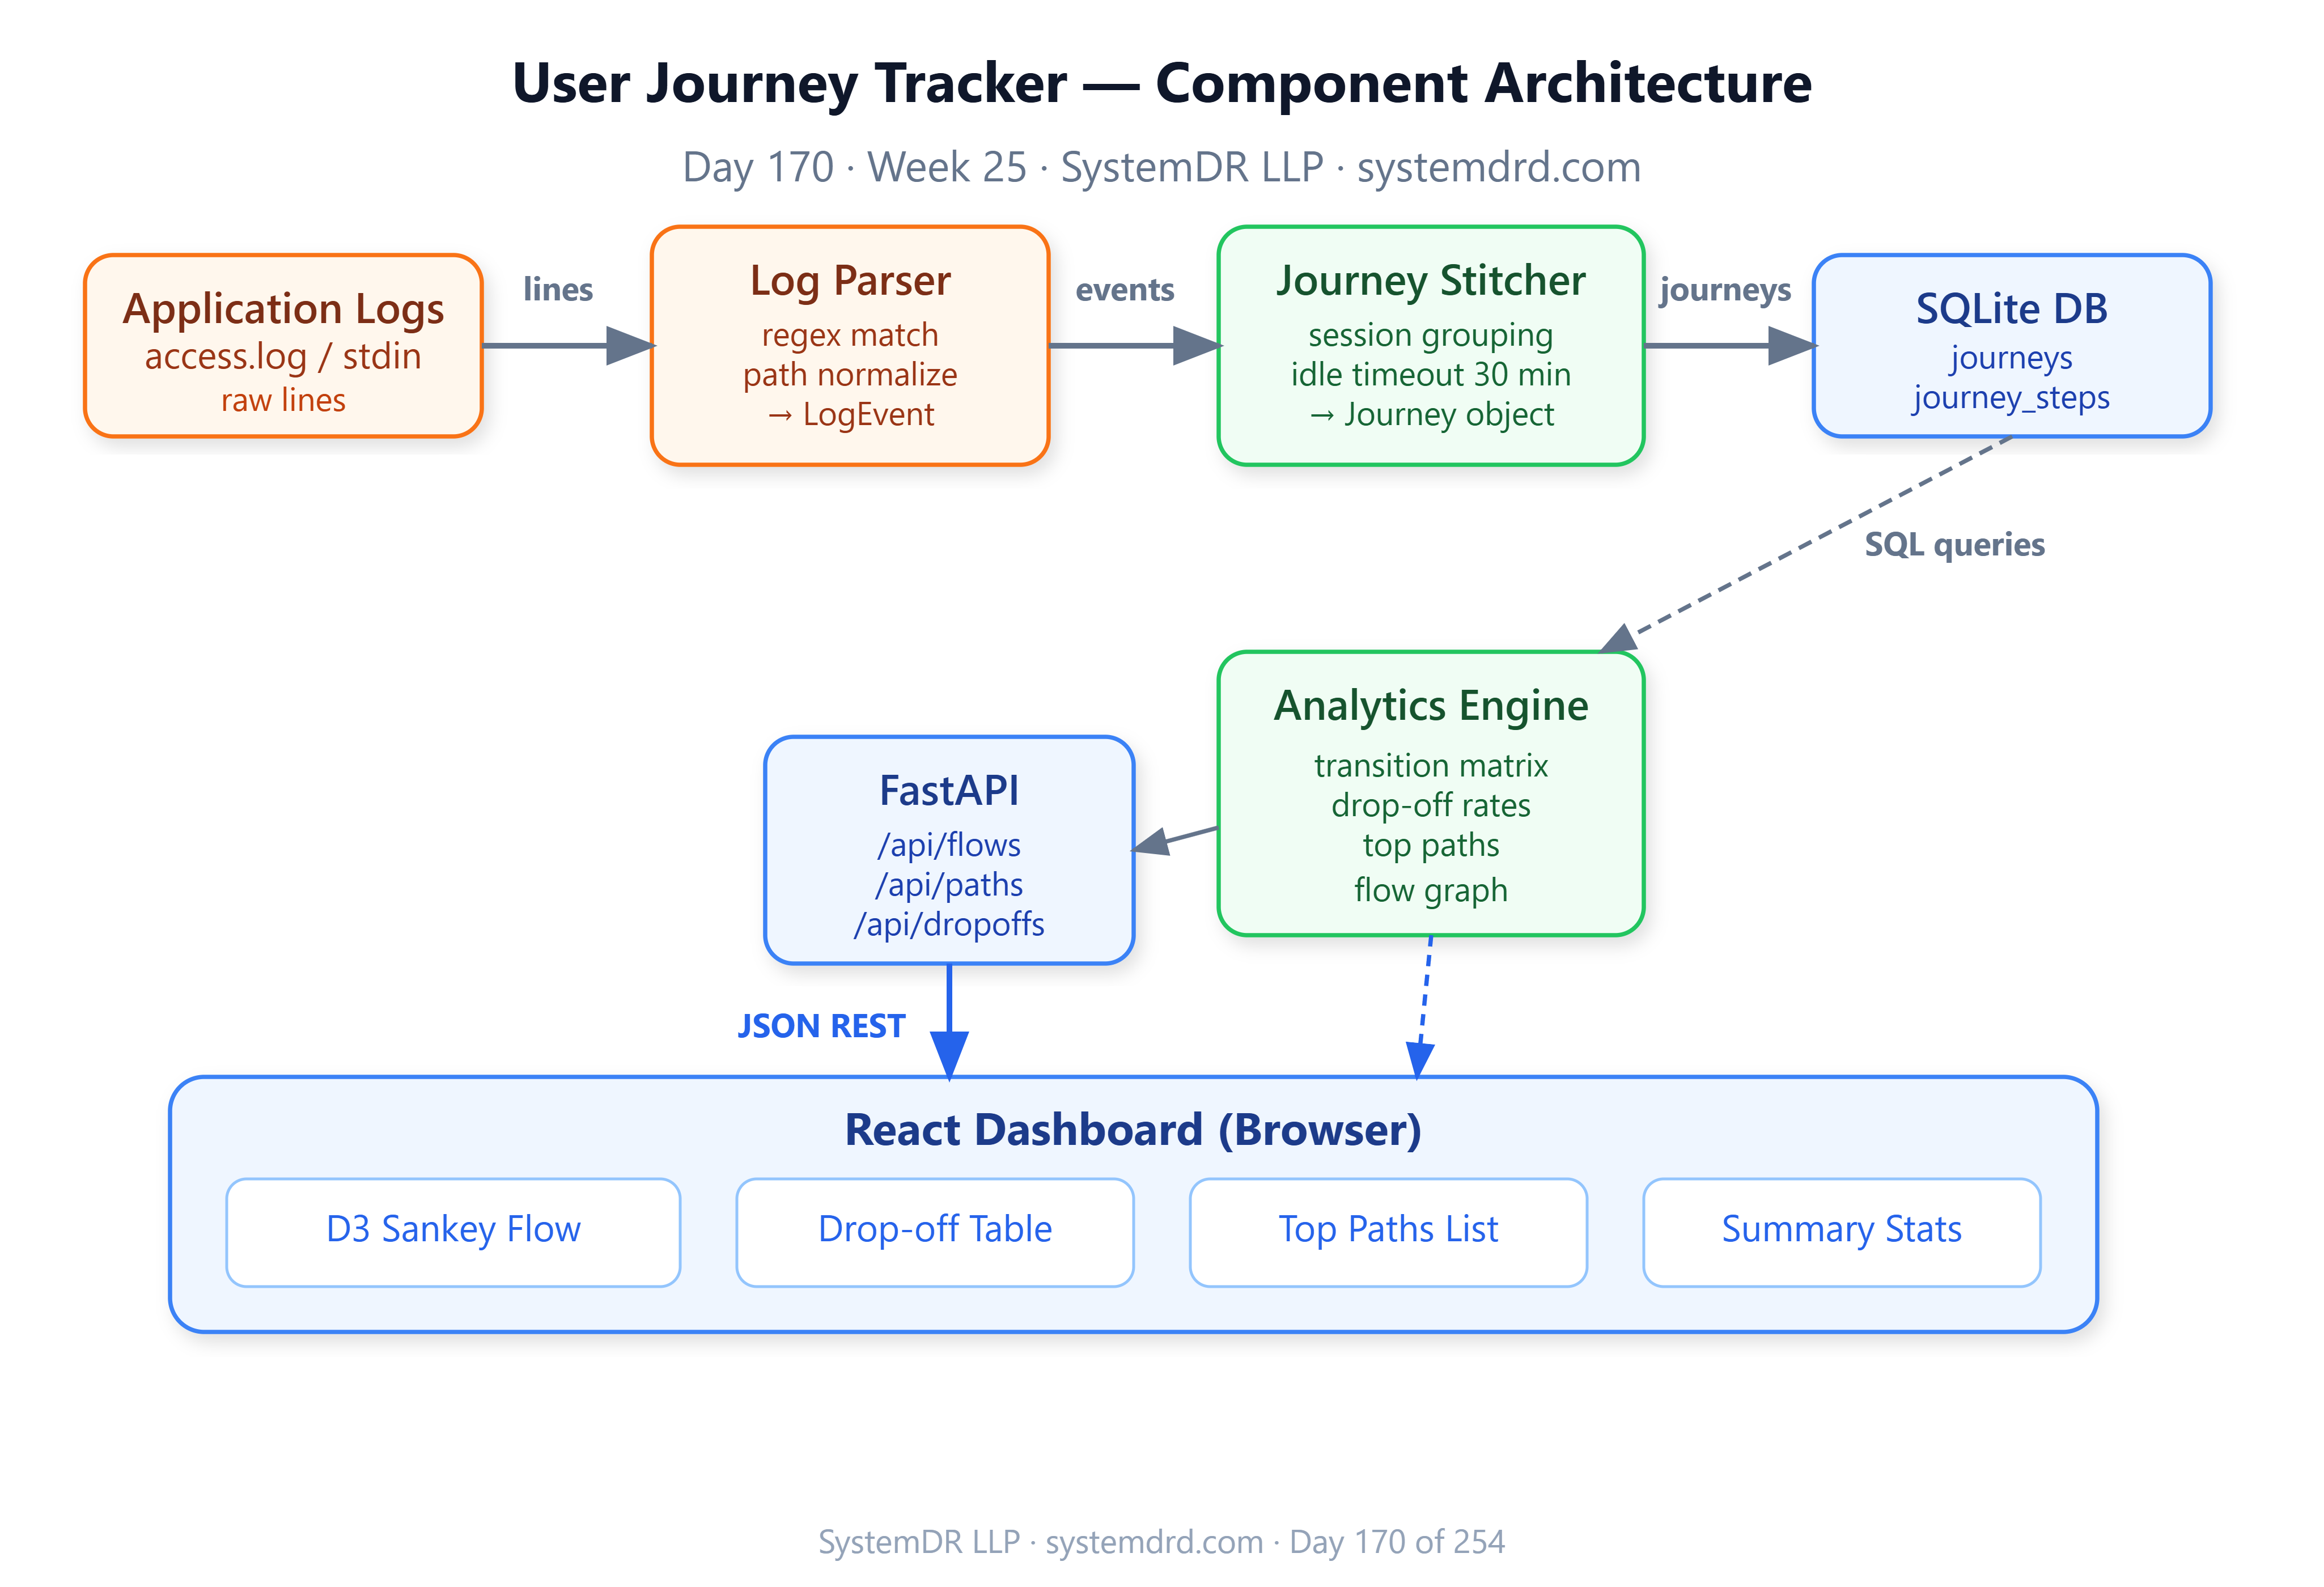
Architecture
Components
Log Ingestor — Tails log files or reads from stdin. Parses each line into a structured LogEvent(user_id, session_id, page, timestamp, metadata).
Journey Stitcher — Maintains an in-memory buffer keyed by (user_id, session_id). Flushes a journey when a session closes or the idle timeout fires. Writes completed journeys to SQLite.
Analytics Engine — Queries SQLite to compute:
Top-N paths (ordered sequences of pages)
Transition matrix:
P(page_B | page_A)for every A→B edgeDrop-off rate per page (sessions that end on that page / sessions that visit it)
Median dwell time per page
API Layer (FastAPI) — Exposes /journeys, /flows, /dropoffs, and /paths endpoints consumed by the dashboard.
React Dashboard — Renders a Sankey flow diagram using D3, a drop-off heat table, and a top-paths list.
Data Flow
app.log → LogIngestor → EventQueue → JourneyStitcher → journeys.db
                                                          ↓
                                              AnalyticsEngine (on-demand)
                                                          ↓
                                               FastAPI (/flows, /paths)
                                                          ↓
                                              React Dashboard (D3 Sankey)
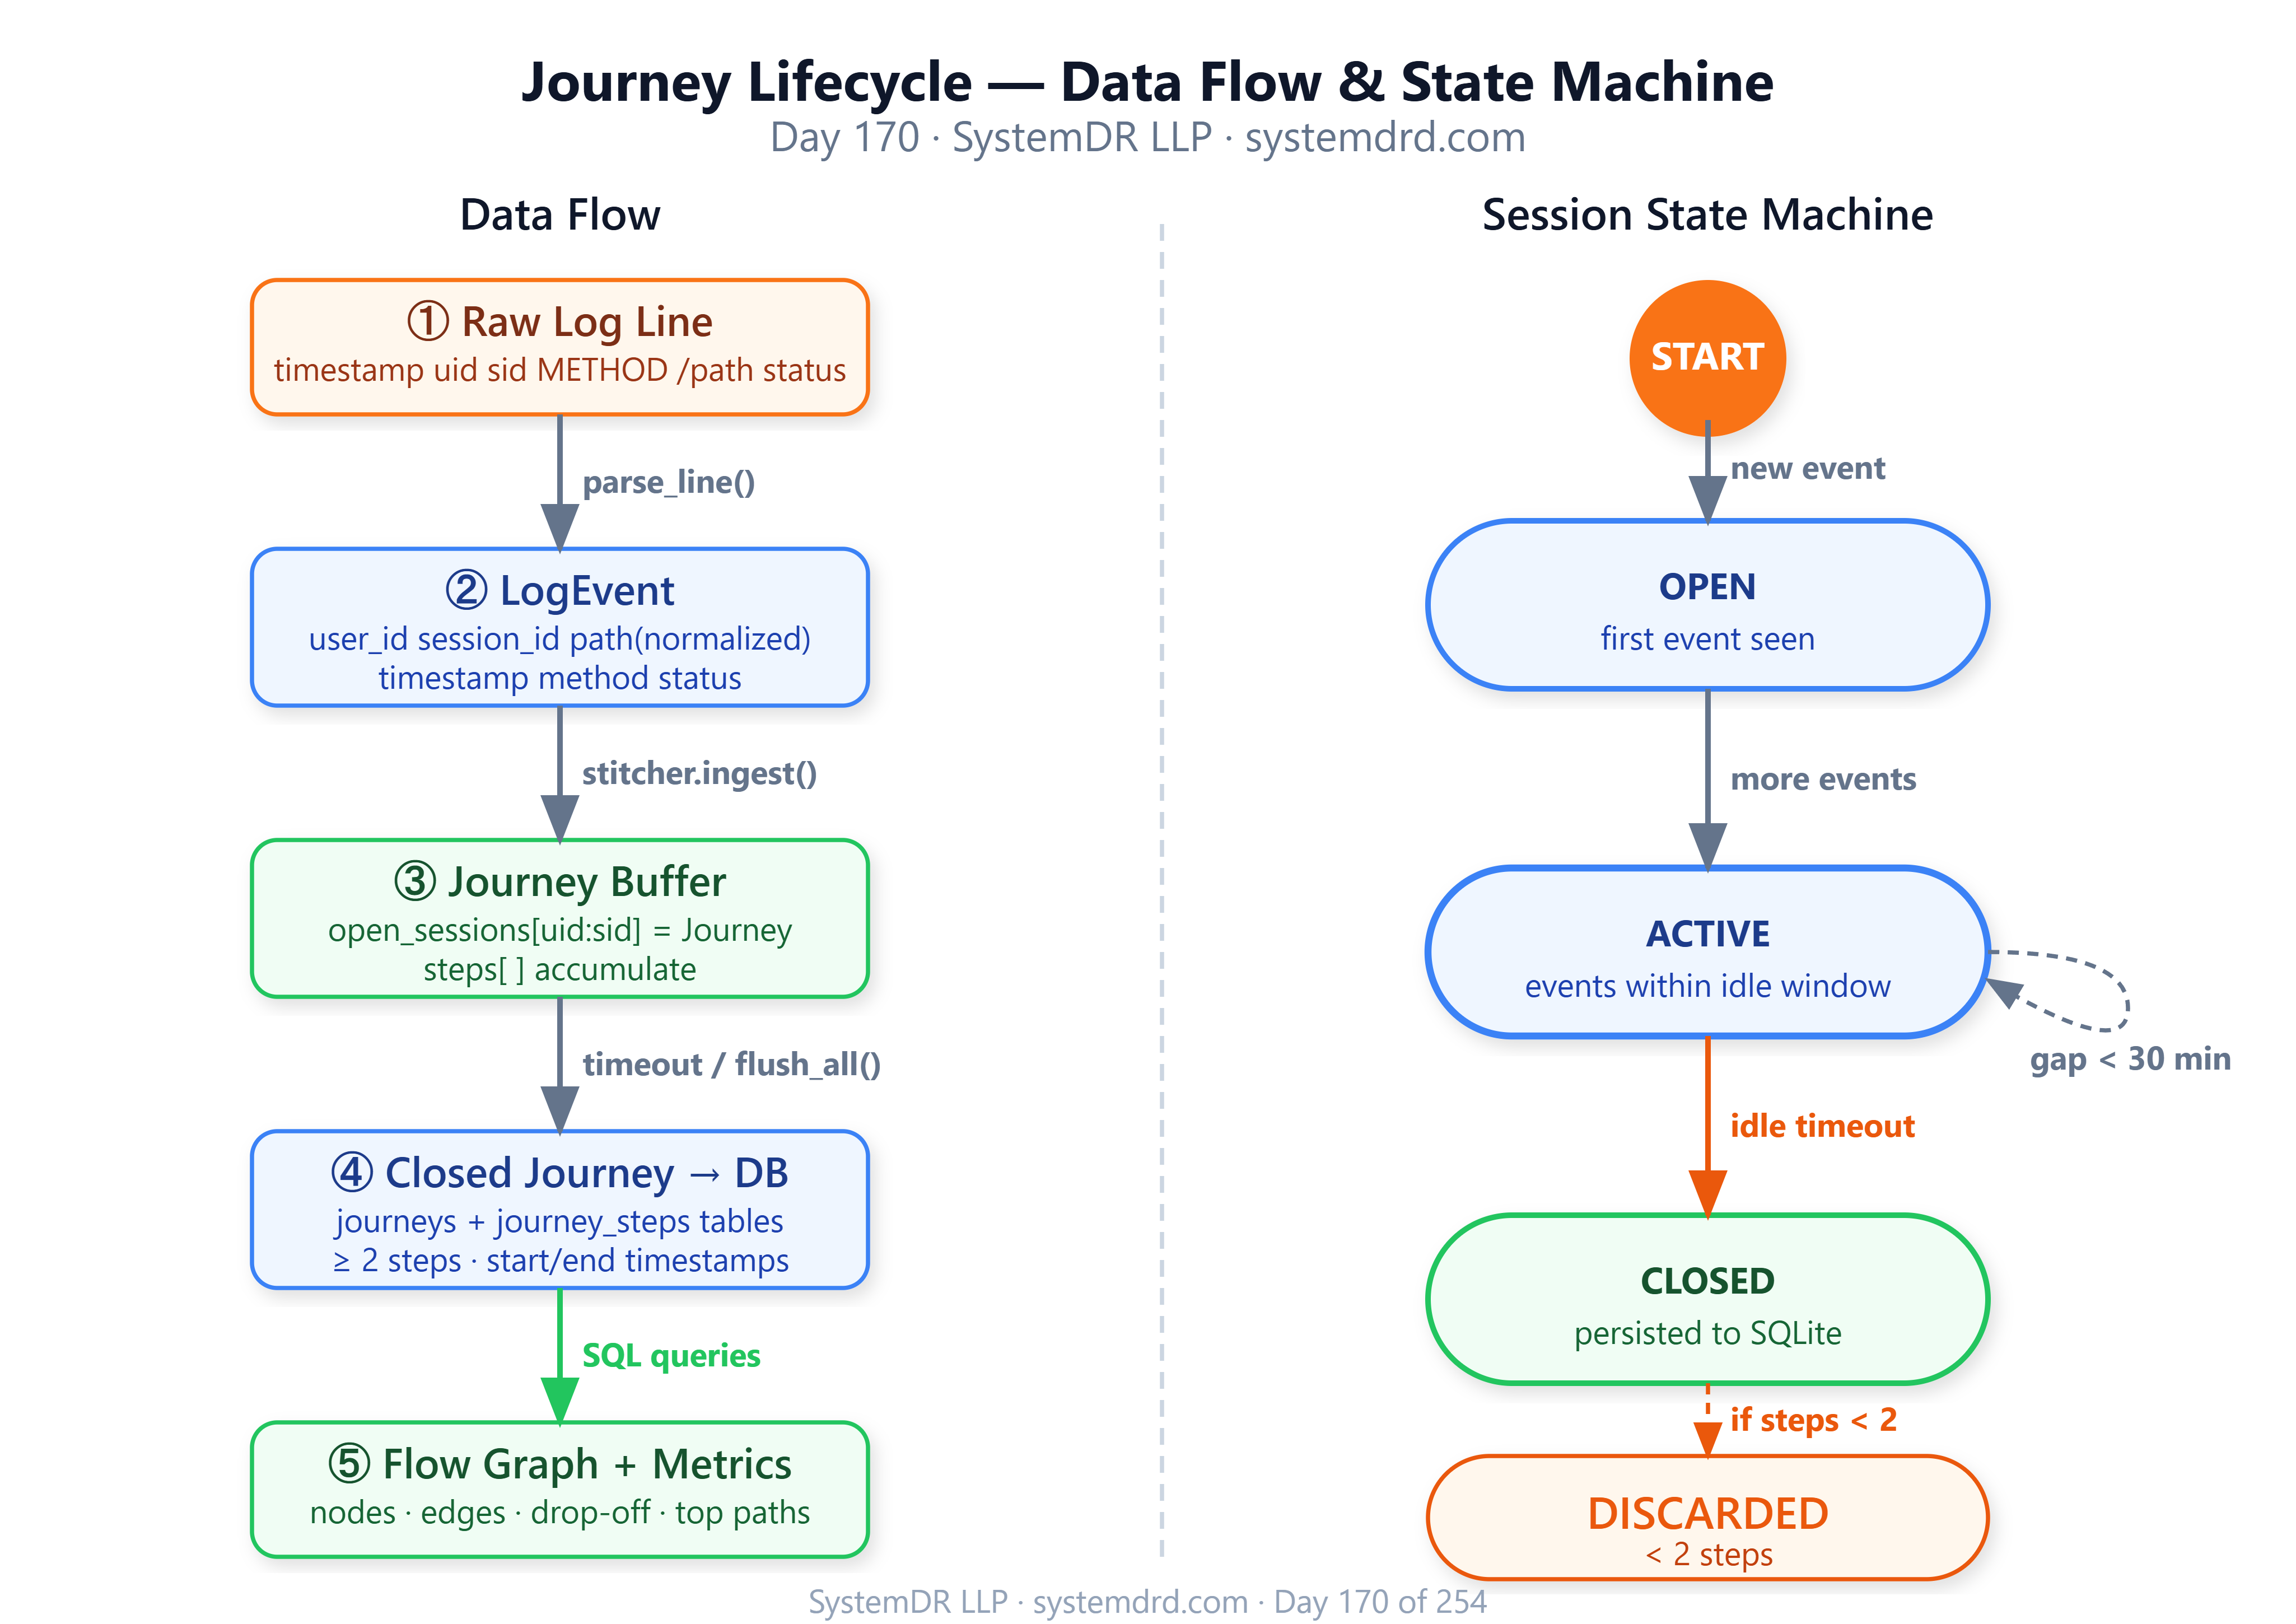
State Machine: Journey Lifecycle
A journey moves through three states:
OPEN — first event seen, session timer running
ACTIVE — events arriving within idle threshold
CLOSED — idle timeout exceeded or explicit session-end event; written to DB
Key Implementation Insights
Session boundary detection without session IDs. If your logs lack explicit session tokens, derive them: sort events by user + timestamp, then split whenever the gap exceeds 30 minutes. This mirrors what Amplitude does server-side.
Path normalization. URL paths like /product/123 and /product/456 are the same step. Apply a regex normalizer before storing — /product/<id> — or your transition matrix explodes in cardinality.
Sliding-window aggregation. Don’t recompute full journey stats on every API call. Maintain pre-aggregated snapshots updated every N seconds via a background task. This pattern is identical to what Mixpanel uses for their real-time funnel engine.
Drop-off vs. bounce. A drop-off is a session ending on a non-terminal page. A bounce is a single-page session. Tracking both separately gives product teams far more actionable data.
Implementation Steps
GitHub Link:
https://github.com/sysdr/course-p/tree/main/day170/day170-user-journey-trackingStep 1 – Project scaffold
mkdir -p user-journey-tracker/{src,tests,logs,web/src,data}
cd user-journey-tracker
Step 2 – Core models
Define LogEvent, Journey, and FlowEdge as Python dataclasses. Use SQLite (stdlib sqlite3) — no ORM needed.
Step 3 – Log parser
Write a regex that extracts timestamp, user_id, session_id, method, path, status from your standard access log format. Make the session_id optional — fall back to derived sessions if absent.
Step 4 – Journey stitcher
class JourneyStitcher:
    def __init__(self, idle_timeout=1800):
        self.open_sessions: dict[str, Journey] = {}
        self.idle_timeout = idle_timeout

    def ingest(self, event: LogEvent) -> Journey | None:
        key = f"{event.user_id}:{event.session_id}"
        # open new or extend existing journey
        # return closed journey if timeout exceeded
Step 5 – Analytics engine
SQL-driven: query journey_steps joined on journeys to build the transition matrix and drop-off counts. All aggregation stays in SQLite — no pandas required.
Step 6 – FastAPI endpoints
GET /api/flows          → {nodes, links} for Sankey
GET /api/paths?top=10   → ranked path sequences
GET /api/dropoffs       → per-page drop-off rates
GET /api/stats          → summary counts
Step 7 – React dashboard
Use D3’s sankey layout (CDN, no build step needed) to render the flow diagram. A plain HTML table shows drop-off rates. Keep the frontend in a single index.html — no bundler.
Build, Test & Verify
# Quick start (no Docker)
./start.sh

# With Docker
docker-compose up --build

# Run tests
python -m pytest tests/ -v

# Hit the API
curl http://localhost:8000/api/flows | jq '.links | length'

# Dashboard
open http://localhost:3000
Expected test output:
tests/test_parser.py::test_parse_valid_line PASSED
tests/test_stitcher.py::test_session_close_on_timeout PASSED
tests/test_stitcher.py::test_path_normalization PASSED
tests/test_analytics.py::test_transition_matrix PASSED
tests/test_api.py::test_flows_endpoint PASSED
====== 5 passed in 1.2s ======
Success Criteria
Check Expected Journeys stored in SQLite after log ingestion ✅ /api/flows returns valid Sankey nodes + links ✅ Drop-off rates sum correctly per page ✅ Dashboard renders Sankey without errors ✅ 1000-event log processed in < 2 seconds ✅
Working Demo Link
Assignment
Build a session replay feature. Given a user_id, return the full ordered event sequence for their last 5 sessions — including timestamps, pages visited, and dwell times.
Hints:
Add a
GET /api/user/{user_id}/replayendpointQuery
journey_stepsordered bystep_indexfor that user’s recent journey IDsCompute dwell time as
next_event.timestamp - current_event.timestampReturn as JSON array; render as a timeline in the dashboard using plain CSS
What’s Next
Tomorrow (Day 171) we build conversion funnel analysis — taking the journey flow graph you built today and slicing it along a defined funnel (e.g., landing → signup → purchase) to compute per-step conversion rates and visualize where users fall off.
The journey tracker you built today is the data source. Funnels are just filtered, directed sub-graphs of your flow.
SystemDR LLP · systemdrd.com · 254-Day Hands-On System Design Series