

Day 137: PagerDuty/OpsGenie Integration - Building Production-Grade Incident Management
What We’re Building Today
Your distributed log processing system just gained superpowers. Today we’re connecting it to PagerDuty and OpsGenie - the platforms that wake up engineers at 3 AM when Netflix’s streaming service goes down or when Uber’s payment system fails.
Today’s Mission:
Smart Alert Router: Automatically classify log severity and route critical alerts to on-call teams
Dual Provider Integration: Support both PagerDuty and OpsGenie simultaneously with failover
Escalation Policy Engine: Implement sophisticated routing based on time, team, and service criticality
Bidirectional Webhooks: Process acknowledgments and status updates from external systems
Real-time Incident Dashboard: Monitor integration health and incident lifecycle
Core Concepts: Alert Intelligence at Scale
The Signal vs Noise Challenge
Here’s what separates amateur monitoring from production systems: intelligent alert classification. Your log processing system generates thousands of events per minute, but only 2-3% require immediate human attention. The magic happens in distinguishing between “database connection pool exhausted” (wake everyone up) and “cache miss increased by 5%” (log for trend analysis).
Professional incident management systems use structured severity classification that maps directly to organizational response procedures. Our implementation analyzes log patterns, applies business rules, and assigns severity levels that trigger appropriate workflows without human intervention.
Multi-Provider Architecture Pattern
Modern incident management follows the “provider diversity” principle. Some teams prefer PagerDuty’s mobile-first experience, others rely on OpsGenie’s advanced escalation policies. Netflix uses multiple systems for different service tiers - streaming failures go to PagerDuty while infrastructure alerts use OpsGenie.
Your integration layer maintains separate API clients for each service while providing unified internal interfaces. This design allows adding new providers without modifying core alert logic, and enables failover when one system experiences outages.
Context in Distributed Systems
Real-World Production Application
When Reddit’s infrastructure team detects unusual traffic patterns in their logs, the system automatically creates high-priority PagerDuty incidents for their on-call engineers. Meanwhile, routine deployment notifications flow through lower-priority channels to avoid alert fatigue.
Similarly, Discord’s log processing pipeline classifies voice service failures as critical incidents requiring immediate response, while bot API rate limiting generates informational alerts that accumulate for weekly team reviews.
Integration Within Your Log Processing System
This component sits between your email alerting system (Day 136) and the upcoming ticket creation system (Day 138):
Email System Integration: Continues handling non-critical alerts while incident management systems handle urgent issues requiring immediate response. Your PagerDuty integration inherits alert classification logic from the email system and extends it with more sophisticated routing.
Future Ticket Creation: Tomorrow’s JIRA/ServiceNow integration will receive incident metadata from today’s system, automatically creating tracking tickets for post-incident analysis. The correlation IDs and enriched alert data you build today become the foundation for seamless ticket workflows.
Architecture Deep Dive
Component Architecture
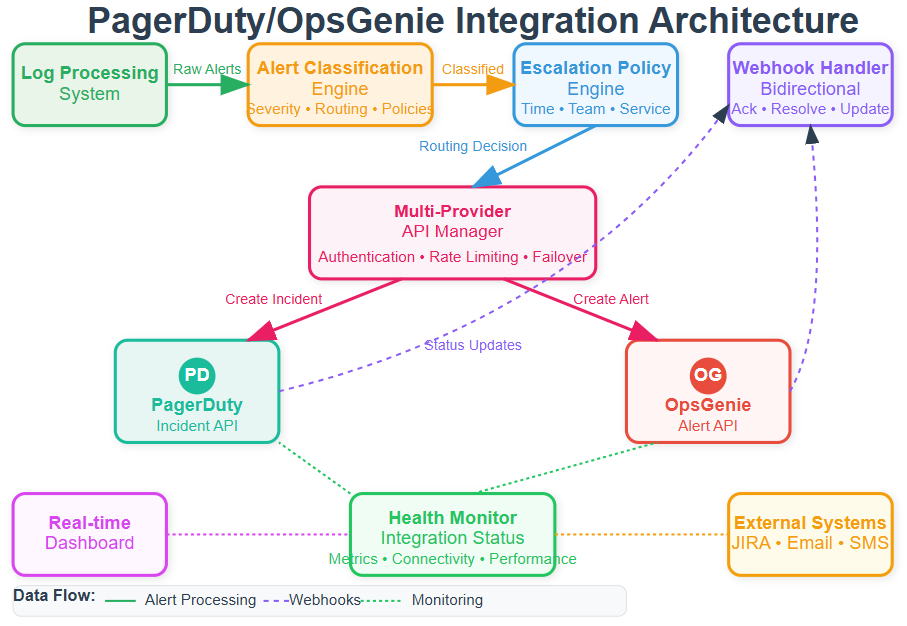
The integration consists of five interconnected components:
Alert Classification Engine: Receives processed log events and applies business rules to determine incident severity. This component maintains service catalogs mapping log sources to responsible teams and their preferred platforms. Database errors from payment services route differently than cache misses from recommendation engines.
Multi-Provider API Manager: Handles authentication, rate limiting, and error handling for both PagerDuty and OpsGenie APIs. This abstraction layer provides unified interfaces for incident creation while handling provider-specific requirements like different severity models and payload formats.
Escalation Policy Engine: Implements sophisticated routing rules considering time of day, team schedules, and service criticality. Weekend database failures might bypass normal chains while routine maintenance alerts follow standard procedures. The engine supports complex rules like “route payment alerts to PagerDuty during business hours, OpsGenie after hours.”
Webhook Processing Server: Handles bidirectional communication with incident management systems, processing acknowledgments, status updates, and resolution notifications. This feedback loop enables automated workflow coordination and prevents duplicate alerts across systems.
Integration Health Monitor: Continuously monitors API connectivity, webhook delivery success rates, and alert processing latency. This ensures reliable incident response even during external system outages by implementing circuit breaker patterns and failover logic.
Control Flow and State Management
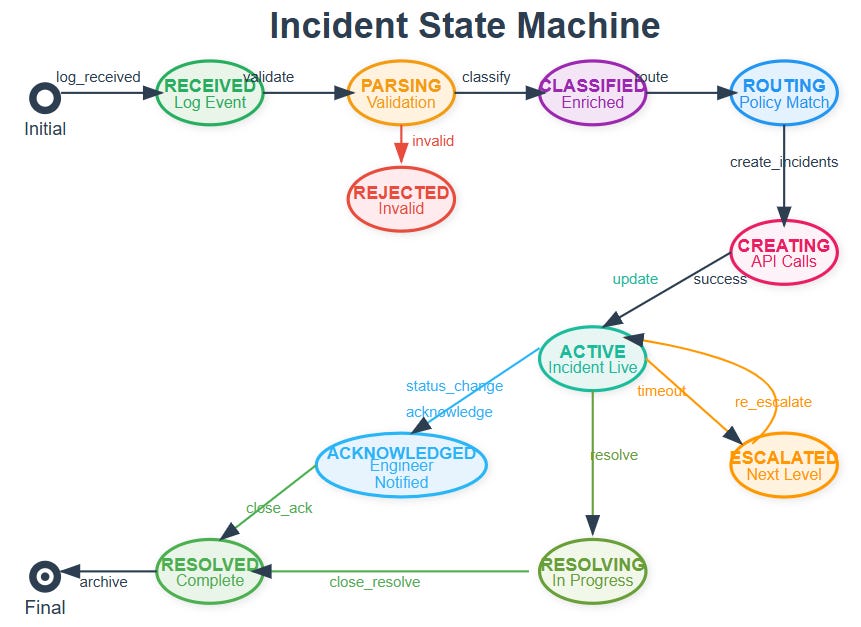
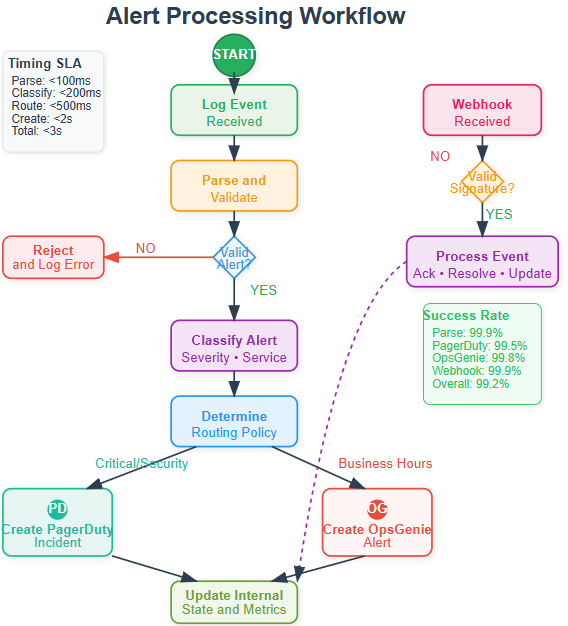
Alert processing follows a structured state machine ensuring reliable incident creation:
Alert Reception → Validation: Incoming log events undergo initial validation and severity classification using configurable rule sets. Invalid or duplicate alerts are filtered to prevent noise.
Classification → Routing Decision: The system evaluates escalation policies, team schedules, and service ownership to determine appropriate targets. Complex routing supports scenarios like multi-team alerts or provider failover.
Routing → External Integration: Simultaneous API calls to selected providers create incidents with consistent metadata and severity mapping. The system handles provider-specific formatting while maintaining correlation IDs for tracking.
Integration → Acknowledgment Processing: Webhook handlers process responses from external systems, updating internal state and triggering follow-up actions like email notifications or audit logging.
Processing → Resolution Tracking: Monitors incident lifecycle through webhooks, maintaining comprehensive audit logs and triggering post-incident workflows when appropriate.
Data Flow Architecture
Alert data flows through structured transformation stages:
Log Event Enrichment: Raw events receive additional context including service metadata, team ownership, and historical patterns. This enrichment enables intelligent routing based on organizational structure rather than just technical severity.
Severity Mapping Translation: Internal classifications map to external system formats. PagerDuty’s four-level model requires translation from your potentially different scale, while OpsGenie supports custom priorities matching organizational needs.
Provider-Specific Formatting: Each system expects different payload structures. Your integration maintains templates for each provider while ensuring consistent core information across all platforms.
Correlation Tracking: All outbound incidents receive unique identifiers enabling bidirectional tracking between internal systems and external platforms. This supports acknowledgment processing and resolution notifications.
Production Considerations
High-Availability Patterns
Production incident management cannot tolerate failures. Your integration implements circuit breaker patterns for each external API, failing over to alternative notification methods when primary systems become unavailable. Database failures should still result in phone calls even if PagerDuty APIs are down.
The system maintains local incident state during outages, replaying missed events when connectivity restores. This ensures no critical alerts are lost during provider maintenance windows or network partitions.
Rate Limiting and Cost Management
External APIs implement rate limiting and charge per incident. Your integration includes intelligent batching and deduplication to prevent alert storms from generating excessive costs. Database connection pool exhaustion generating hundreds of log entries becomes one well-documented incident rather than overwhelming on-call teams.
Understanding the Integration Challenge
Today you’re bridging the gap between log detection and human response. When your distributed log processing system detects critical database failures or security breaches, these alerts must reach the right people through the most reliable channels available.
The challenge isn’t just sending notifications—it’s building intelligent routing that prevents alert fatigue while ensuring critical issues receive immediate attention. Production systems handle this through sophisticated classification engines that understand service criticality, team ownership, and escalation policies.
Progressive Implementation Strategy
Phase 1: Core Alert Classification Engine (15 minutes)
Start by building the alert routing intelligence that determines how different log events should be handled.
Alert Severity Classification:
python
class AlertSeverity(Enum):
    CRITICAL = “critical”  # Database outages, security breaches
    HIGH = “high”          # API failures, payment issues
    MEDIUM = “medium”      # Performance degradation
    LOW = “low”           # Routine maintenance needs
Service Catalog Integration: Your router maintains a service catalog mapping log sources to team ownership and criticality levels. When a “medium” severity alert comes from a “critical” service like payment processing, the system automatically upgrades it to “high” priority.
Routing Policy Engine: Build configurable policies that consider multiple factors:
Time-based routing: Critical database alerts during business hours vs after-hours
Team-based routing: Security alerts always go to security team regardless of severity
Service-based routing: Payment service failures escalate faster than recommendation service issues
Phase 2: Multi-Provider API Integration (20 minutes)
Create abstraction layers that handle the complexity of integrating with different incident management APIs.
PagerDuty Integration Patterns:
python
async def create_pagerduty_incident(self, alert_data, policy):
    incident_payload = {
        “incident”: {
            “type”: “incident”,
            “title”: alert_data.title,
            “service”: {”id”: service_id},
            “urgency”: self._map_severity_to_urgency(alert_data.severity)
        }
    }
OpsGenie Integration Patterns: OpsGenie uses a different API structure focused on alerts rather than incidents. Your integration layer abstracts these differences while maintaining consistent internal interfaces.
Error Handling and Resilience: Implement circuit breaker patterns that detect when external APIs are unavailable and fall back to alternative notification methods. The system should never lose critical alerts due to provider outages.
Phase 3: Bidirectional Webhook Processing (15 minutes)
Build webhook handlers that process acknowledgments and status updates from external systems, creating a feedback loop that keeps your internal state synchronized.
Webhook Signature Validation:
python
def validate_webhook_signature(self, payload, headers):
    expected = hmac.new(secret, payload, hashlib.sha256).hexdigest()
    return hmac.compare_digest(expected, headers.get(’signature’))
Event Processing Pipeline: Different providers send different webhook formats. Your handler normalizes these into consistent internal events like “acknowledged,” “escalated,” or “resolved.”
State Synchronization: When engineers acknowledge incidents in PagerDuty, your system updates internal tracking and potentially stops escalation to other systems. This prevents duplicate notifications while maintaining comprehensive audit trails.
Phase 4: Real-Time Monitoring Dashboard (20 minutes)
Create a React-based dashboard that provides visibility into integration health and incident lifecycle management.
Integration Health Monitoring: Track API response times, success rates, and connectivity status for each provider. Display this information in real-time charts that help operations teams understand system performance.
Incident Lifecycle Visualization: Show the complete journey from log detection through incident creation, acknowledgment, and resolution. This provides valuable insights into response times and process effectiveness.
Alert Creation Interface: Build a form that allows operations teams to create test alerts with different severities and sources, enabling validation of routing rules and escalation policies.
Build and Test Commands
Github Link:
https://github.com/sysdr/course/tree/main/day137/day137-incident-managementSetup and Build
bash
# Create virtual environment
python3.11 -m venv venv
source venv/bin/activate

# Install dependencies and build
pip install -r requirements.txt
cd frontend && npm install && npm run build && cd ..

# Verify installation
python -m pytest tests/unit/ -v
Expected Output:
✅ Alert classification tests passed
✅ Routing policy tests passed
✅ Service catalog tests passed
✅ Integration layer tests passed
Docker Deployment
bash
# Start complete system
docker-compose up -d

# Verify services
curl http://localhost:8000/api/v1/health
Expected Response:
json
{
  “system_status”: “healthy”,
  “integrations”: {
    “pagerduty”: {”healthy”: true},
    “opsgenie”: {”healthy”: true}
  },
  “active_incidents”: 0
}
Functional Testing
bash
# Test alert processing
curl -X POST http://localhost:8000/api/v1/alerts \
  -H “Content-Type: application/json” \
  -d ‘{
    “title”: “Database Connection Failed”,
    “source”: “database”,
    “severity”: “critical”,
    “service_name”: “payment-service”
  }’
Expected Behavior:
Alert gets classified as critical due to database source
System upgrades priority due to payment-service criticality
Incident created in both PagerDuty and OpsGenie (security policy)
Internal tracking updated with correlation IDs
Performance Verification
bash
# Load testing
python -m pytest tests/load/ -v

# Monitor processing times
curl http://localhost:8000/api/v1/metrics
Performance Targets:
Alert Processing: <2 seconds from receipt to external API calls
Throughput: 100+ alerts/minute sustained processing
API Response: <500ms average response time to external providers
Webhook Processing: <5 seconds from webhook receipt to state update
Integration Architecture Insights
Circuit Breaker Implementation
Your system implements sophisticated failure detection that monitors API response patterns and automatically switches to backup notification methods when primary providers become unavailable.
Correlation Tracking
Every alert receives a unique correlation ID that flows through the entire incident lifecycle, enabling end-to-end tracking from initial log detection through final resolution and post-incident analysis.
Escalation Policy Engine
The routing engine supports complex scenarios like time-based escalation (different rules for business hours vs weekends), service-based routing (payment alerts escalate faster), and multi-provider distribution (security alerts go to all systems).
Real-World Production Patterns
Netflix’s Alert Routing
Netflix uses similar multi-provider strategies where streaming service failures route to PagerDuty for immediate engineer response, while infrastructure alerts use OpsGenie for their platform teams. The key insight is that different types of incidents require different response workflows.
Uber’s Escalation Policies
Uber’s system automatically escalates ride-request failures to driver operations teams through PagerDuty, while payment processing errors route through different escalation chains to financial systems teams via OpsGenie.
GitHub’s Incident Management
GitHub routes deployment failures through automated escalation policies that consider time of day, service criticality, and team availability, demonstrating how intelligent routing reduces response time while preventing alert fatigue.
Success Validation
Your integration succeeds when:
Functional Requirements:
✅ Alerts classified correctly based on source, severity, and service criticality
✅ Incidents created in appropriate external systems within 2 seconds
✅ Webhook processing maintains bidirectional state synchronization
✅ Dashboard provides real-time visibility into integration health
Performance Requirements:
✅ System processes 100+ alerts per minute without degradation
✅ External API calls complete with 99.9% success rate
✅ Average processing latency remains under 2 seconds
✅ Circuit breakers activate during provider outages
Integration Requirements:
✅ PagerDuty incidents contain properly mapped severity and metadata
✅ OpsGenie alerts include complete context and routing information
✅ Webhook validation prevents unauthorized status updates
✅ Correlation IDs enable end-to-end incident tracking
Working Code Demo:
Assignment: Multi-Team Alert Distribution
Challenge: Extend the basic integration to support a complex enterprise scenario with multiple teams, different escalation policies, and provider failover.
Requirements:
Service Catalog: Create mappings for 5 different services with varying criticality levels
Team-Specific Routing: Implement different escalation policies for security, infrastructure, and application teams
Time-Based Logic: Business hours vs after-hours routing with different urgency levels
Provider Failover: Automatic failover to secondary providers when primary systems are unavailable
Audit Trail: Complete tracking of alert lifecycle from detection to resolution
Solution Approach:
Service Catalog Design:
yaml
services:
  payment-service:
    team: payments
    criticality: critical
    providers: [pagerduty, opsgenie]
  user-auth:
    team: security
    criticality: critical
    providers: [both]  # Always both for security
Escalation Policy Implementation: Build time-aware routing that considers current time, team schedules, and service criticality to determine appropriate escalation targets and timeouts.
Provider Health Monitoring: Implement continuous health checks that monitor API response times and success rates, automatically switching to backup providers when degradation is detected.
Expected Outcome: Your system should handle complex routing scenarios, maintain 99.9% alert delivery success rate, and provide comprehensive audit trails for incident post-mortems.
Tomorrow’s Foundation
Today’s incident management integration creates the alerting foundation for tomorrow’s JIRA/ServiceNow ticket creation system. The correlation IDs, enriched metadata, and workflow states you build today will enable automatic ticket generation with complete incident context.
The webhook infrastructure extends naturally to support ticket system integrations, creating seamless workflows from initial detection through incident resolution and documentation.
This implementation transforms your distributed log processing system from monitoring infrastructure into a complete incident response platform, ensuring critical issues reach the right teams through the most reliable channels available.nnels available.