Day 132: Implement Error Tracking Features
Building Production-Grade Error Intelligence with Automatic Grouping
Today’s Mission
Today we’re implementing an intelligent error tracking system that automatically groups similar errors, tracks their lifecycle, and provides actionable insights. Think Sentry or Rollbar, but built from scratch to integrate seamlessly with your distributed log processing pipeline.
What We’re Building:
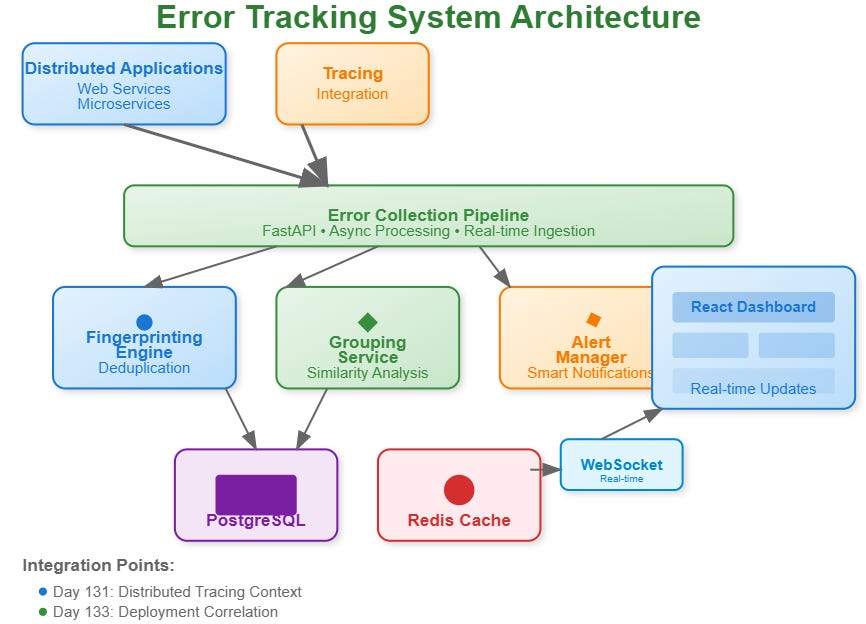
Error Collection Engine that captures errors from distributed applications
Smart Fingerprinting that groups identical errors using content-based hashing
Real-time Aggregation combining similar errors into manageable incidents
Intelligent Alerting that notifies teams when error patterns become concerning
Modern Dashboard built with React for error investigation and management
Core Concepts: Error Intelligence at Scale
Error Fingerprinting and Deduplication
Error fingerprinting creates unique signatures for errors based on stack traces, error messages, and context. Instead of storing 10,000 identical database timeout errors, you store one error pattern with a count of 10,000 occurrences.
The fingerprinting algorithm combines:
Stack trace similarity (ignoring dynamic values like line numbers in dynamic languages)
Error message patterns (normalizing variable data like user IDs, timestamps)
Execution context (similar request paths, user agents, geographic regions)
Intelligent Error Grouping
Real production systems generate thousands of similar errors that need intelligent clustering. Our grouping engine uses similarity scoring algorithms to merge errors that represent the same underlying issue.
The system calculates similarity scores using weighted factors:
Stack trace overlap percentage (70% weight)
Error message semantic similarity (20% weight)
Context similarity like user agent, request path (10% weight)
Error Lifecycle Management
Each error group transitions through states: New → Acknowledged → Resolved → Regressed. This lifecycle helps engineering teams prioritize and track resolution progress systematically.
Context in Distributed Systems
Integration with Distributed Tracing
Building on Day 131’s tracing implementation, our error tracker correlates errors with distributed traces. When an error occurs during a multi-service request, you see the complete request flow leading to the failure.
This correlation enables:
Root cause analysis across service boundaries
Performance impact assessment of errors on overall request latency
Service dependency mapping showing which services contribute to error propagation
Real-World Production Context
Major platforms like GitHub handle millions of requests generating thousands of unique errors daily. Without intelligent grouping, engineering teams would drown in noise. Netflix’s error tracking system processes over 100 million error events daily, using similar fingerprinting techniques to maintain system observability.
The challenge isn’t just collecting errors—it’s making them actionable for engineering teams while maintaining system performance under high error volumes.
Architecture Deep Dive