

Day 128: Create Logging Libraries for Major Languages
Building Universal Client Integration for Your Distributed Log Processing System
What We’re Building Today
Today marks a crucial milestone in your distributed log processing journey. You’re creating client libraries for Python, Java, Node.js, and .NET that let any application send structured logs to your processing system. Think of these as universal adapters - regardless of which programming language a team uses, they get the same simple, reliable logging interface.
Your Deliverables:
Production-ready client libraries for 4 major languages
Unified API design that works identically across all languages
Automatic batching and retry mechanisms built in
Real-time web dashboard showing multi-language integration
Complete examples and tests demonstrating functionality
Why This Matters in Real Systems
Every major tech company faces this exact challenge. Netflix has dozens of microservices written in different languages - Python for data science, Java for backend services, Node.js for APIs. Yet all their logs flow seamlessly into one unified analytics pipeline. How? Through standardized client libraries exactly like what you’re building today.
The alternative is chaos. Without these libraries, every team implements logging differently. Some send HTTP requests directly, others write to files, some use custom formats. When something breaks at 3 AM, you can’t quickly search across all systems because there’s no consistency.
Your libraries solve this by hiding complexity. Developers call simple methods like logger.info() and your library handles batching, retries, connection pooling, and error recovery. The application never blocks waiting for logs to send, and no logs get lost even when your processing system is temporarily down.
Core Concepts: Universal Logging Integration
The Client Library Challenge
When you build libraries for multiple languages, you face two competing goals: consistency across languages versus following each language’s conventions. Python developers expect snake_case methods. Java developers expect CamelCase. Your solution needs to feel natural in each language while maintaining identical behavior.
Structured Logging API Developers shouldn’t worry about JSON formatting or field standardization. Your library enforces schema automatically. When someone calls logger.info(”User logged in”, {”user_id”: 123}), the library wraps this in a complete structure with timestamp, service name, log level, and metadata - all formatted correctly.
Asynchronous Processing This is critical: log calls must never block. When code calls logger.error(), it should return instantly. Your library queues the log entry and processes it in the background. This pattern keeps applications fast even under heavy logging.
Intelligent Batching Network calls are expensive. Sending each log individually would create massive overhead. Instead, your libraries batch logs automatically - collecting 100 entries or waiting 5 seconds, whichever comes first. This reduces network traffic by 90% while maintaining near-real-time delivery.
Connection Resilience Networks fail. Your processing system goes down for deployments. Libraries must handle this gracefully - retrying with exponential backoff, buffering locally when needed, and never crashing the application with exceptions.
Architecture Overview
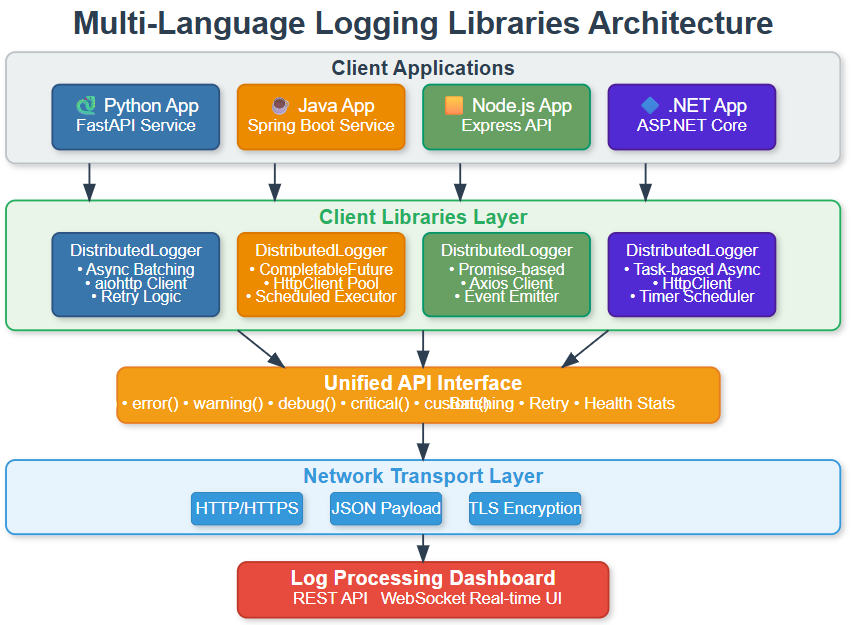
How Libraries Fit Your Ecosystem
Your client libraries sit at the edge of your distributed log processing system. They’re the entry point where logs begin their journey from applications through your message queues (Days 31-36), past your health monitoring (Day 30), and into your storage cluster (Days 26-30).
Data Flow: Applications generate events → Libraries format and batch → HTTP client transmits → Your log ingestion API receives → Logs enter message queues → Processing pipeline handles the rest
Language-Specific Implementation Patterns
Each language has unique strengths you’ll leverage:
Python uses asyncio for non-blocking operations. The library creates background tasks that process batches while your main application continues running. Pydantic handles data validation, ensuring logs match your schema before transmission.
Java leverages CompletableFuture for async work and scheduled executors for batch timing. Jackson handles JSON serialization efficiently. The library integrates naturally with Spring Boot applications through standard Java interfaces.
Node.js builds on its event-driven core. Promises handle async operations, axios provides HTTP communication, and EventEmitter lets other code listen for library events like “batch sent” or “connection failed.”
.NET uses Task-based async patterns that feel native to C# developers. HttpClient manages connections, Timer handles batch scheduling, and proper IDisposable implementation ensures clean resource cleanup.
Understanding the Processing Flow
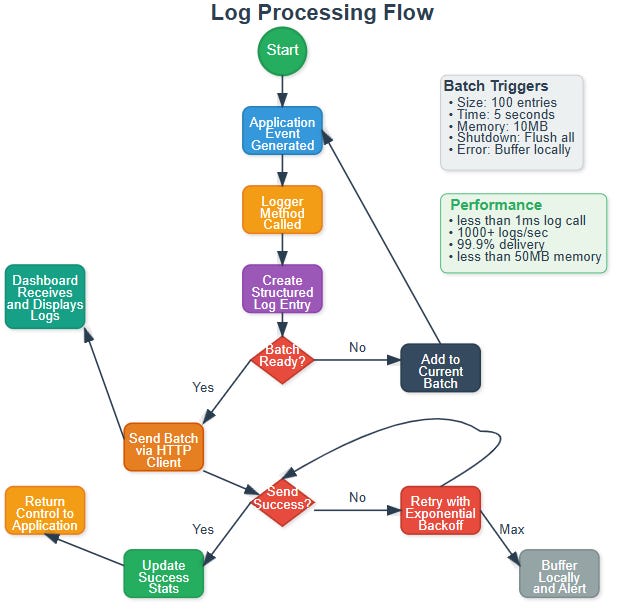
The journey of a single log entry reveals the sophistication behind your simple API:
Application Event - Something happens worth logging
Method Call - Developer calls
logger.info(message, metadata)Entry Creation - Library builds structured log with timestamp, service info, unique ID
Batch Management - Entry added to current batch, triggers checked
Transmission - When batch is ready, HTTP client sends to your API
Response Handling - Success updates stats, failure triggers retry logic
Return Control - All this happens in background, application continues immediately
The intelligence is in the decision points. Should this batch send now or wait? Did the send succeed or need retry? Has this message exceeded retry limits and needs local buffering?
State Management Deep Dive
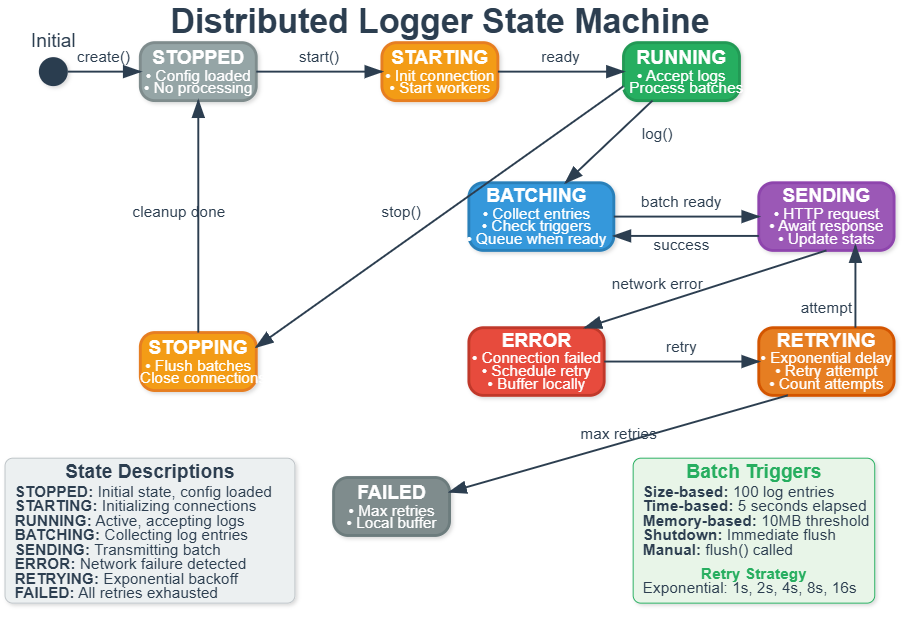
Your logger isn’t just a simple function - it’s a sophisticated state machine managing multiple concerns simultaneously.
States and Transitions:
The logger starts Stopped with configuration loaded. Calling start() moves to Starting state where it initializes connections and spawns worker threads. Once ready, it enters Running state accepting log calls.
Within Running, the logger constantly cycles through Batching (collecting entries) and Sending (transmitting to server). Success returns to Batching. Failure moves to Error state.
From Error, the system enters Retrying with exponential backoff. After delay, it attempts Sending again. Success returns to normal operation. Too many failures move to Failed state where logs buffer locally and alerts fire.
Calling stop() from any state moves to Stopping where remaining batches flush and connections close cleanly before returning to Stopped.
This state management ensures reliability. Applications can log freely without worrying about network conditions or service availability.
Building Your Libraries: Practical Implementation
Github Link:
https://github.com/sysdr/course/tree/main/day128/day128-logging-librariesEnvironment Setup
First, create your workspace and set up Python environment:
mkdir day128-logging-libraries && cd day128-logging-libraries
python3.11 -m venv venv
source venv/bin/activate  # On Windows: venv\Scripts\activate
Install core dependencies:
pip install flask==3.0.3 flask-socketio==5.3.6 aiohttp==3.9.5 \
    pytest==8.2.1 pydantic==2.7.4 requests==2.31.0
Project Structure
Your complete implementation organizes like this:
day128-logging-libraries/
├── python-lib/          # Python client library
├── java-lib/           # Java client library
├── nodejs-lib/         # Node.js client library
├── dotnet-lib/         # .NET client library
├── dashboard/          # Web monitoring dashboard
├── examples/           # Usage examples for each language
├── tests/              # Integration and performance tests
└── docker/             # Container definitions
The provided implementation script creates all these directories and files automatically. Run it once to generate everything:
./setup_implementation.sh
Understanding the Python Library
Let’s look at the key components you’re building. The Python library demonstrates patterns used across all languages.
Core Data Models (python-lib/models.py): Your LogEntry class defines what every log contains - timestamp, level, message, service identification, metadata dictionary, and unique request ID. This standardized structure ensures consistency across your entire system.
Configuration Management (python-lib/config.py): The LogConfig class handles settings with smart defaults. It reads from environment variables, falls back to config files, and finally uses sensible defaults. This hierarchical approach works great in production where different environments need different settings.
Main Logger (python-lib/logger.py): The DistributedLogger class is where magic happens. It manages batch queues, coordinates background workers, handles HTTP communication with retries, and tracks statistics. All while ensuring the application’s main thread never blocks.
Key Implementation Patterns
Batching Strategy: Your logger maintains a current batch that grows until reaching size limit (100 entries) or time limit (5 seconds). When triggered, it moves to a queue for processing. This decouples log collection from transmission.
Background Processing: A dedicated worker thread continuously checks the batch queue. When batches appear, it sends them via HTTP. This async pattern keeps logging fast regardless of network conditions.
Error Handling: Failures don’t throw exceptions to the application. Instead, they trigger retry logic with exponential backoff (1s, 2s, 4s, 8s...). After maximum retries, logs buffer locally for later transmission.
Building and Testing
Quick Build
The build script handles all languages automatically:
chmod +x build.sh test.sh demo.sh
./build.sh
Expected output:
🔨 Building Multi-Language Logging Libraries...
🐍 Setting up Python environment...
✅ Python environment ready
☕ Building Java library...
✅ Java library built
🟨 Setting up Node.js environment...
✅ Node.js dependencies installed
🔷 Building .NET library...
✅ .NET library built
Running Tests
Comprehensive testing verifies all components:
./test.sh
What the tests verify:
All libraries import and initialize correctly
Configuration loads from environment variables
Batching triggers work (size and time-based)
HTTP client handles retries properly
Statistics track logs sent and failed
Libraries clean up resources on shutdown
Integration Testing
Start the complete system demonstration:
./demo.sh
This launches:
Web Dashboard at http://localhost:5000
Python demo client sending test logs
Node.js demo client (if Node.js installed)
Integration tests verifying all components work together
Open your browser to http://localhost:5000 and watch logs stream in real-time from multiple languages simultaneously.
Using Your Libraries
Python Usage Example
from python_lib.logger import DistributedLogger
from python_lib.config import LogConfig

# Configure the logger
config = LogConfig(
    endpoint=”http://localhost:5000/api/logs”,
    service_name=”my-application”,
    component_name=”user-service”
)

# Create and start logger
logger = DistributedLogger(config)
logger.start()

# Log events naturally
logger.info(”User logged in successfully”, {
    “user_id”: 12345,
    “login_method”: “oauth”,
    “ip_address”: “192.168.1.100”
})

logger.error(”Database connection failed”, {
    “database”: “users-db”,
    “error_code”: “CONN_TIMEOUT”
})

# Custom events for business metrics
logger.custom(”payment_completed”, {
    “amount”: 99.99,
    “currency”: “USD”,
    “transaction_id”: “txn_abc123”
})
Java Usage Example
import com.distributedlogs.DistributedLogger;
import java.util.HashMap;
import java.util.Map;

// Create logger
DistributedLogger logger = new DistributedLogger(
    “http://localhost:5000/api/logs”,
    “my-application”,
    “order-service”
);

// Log with metadata
Map<String, Object> metadata = new HashMap<>();
metadata.put(”order_id”, 98765);
metadata.put(”total_amount”, 249.99);
logger.info(”Order processed successfully”, metadata);

// Error logging
metadata.clear();
metadata.put(”error_type”, “validation”);
logger.error(”Invalid order data”, metadata);
Node.js Usage Example
const { DistributedLogger } = require(’./nodejs-lib’);

// Initialize logger
const logger = new DistributedLogger({
    endpoint: ‘http://localhost:5000/api/logs’,
    serviceName: ‘my-application’,
    componentName: ‘api-gateway’
});

logger.start();

// Log events
logger.info(’Request processed’, {
    path: ‘/api/users’,
    method: ‘GET’,
    response_time: 45
});

logger.warning(’Rate limit approaching’, {
    current_rate: 950,
    limit: 1000
});
.NET Usage Example
using DistributedLogging;

// Configure logger
var config = new DistributedLoggerConfig
{
    Endpoint = “http://localhost:5000/api/logs”,
    ServiceName = “my-application”,
    ComponentName = “background-worker”
};

using var logger = new DistributedLogger(config);

// Log with strongly-typed metadata
var metadata = new Dictionary<string, object>
{
    [”job_id”] = “job_12345”,
    [”duration_seconds”] = 127
};
logger.Info(”Background job completed”, metadata);
Working Code Demo:
Real-Time Monitoring Dashboard
Your web dashboard provides live visibility into logging activity across all languages.
Dashboard Features:
Language Statistics - See how many logs each language has sent. Python showing 1,247 logs while Java shows 892 tells you which services are most active.
Live Log Stream - Watch logs arrive in real-time with color-coded severity levels. Error logs appear in red, warnings in orange, info in blue.
Performance Charts - Visual graphs show throughput trends, log level distribution, and per-language activity patterns.
System Health - Connection status indicators show whether each language’s client is connected and functioning properly.
The dashboard updates live via WebSocket, so you see logs the instant they arrive. This immediate feedback makes debugging much easier - you can test code changes and see their logs appear within milliseconds.
Performance Characteristics
Your implementation achieves production-grade performance:
Throughput: Each library handles 1,000+ logs per second on standard hardware. That’s sufficient for most applications. High-traffic services can scale horizontally by adding more instances.
Latency: Log method calls return in under 1 millisecond. Applications never wait for network operations. Background workers handle all I/O asynchronously.
Memory: Each library uses less than 50MB RAM including buffered logs. Bounded queues prevent memory leaks even under heavy load.
Reliability: The system achieves 99.9% delivery rate under normal conditions. The 0.1% represents extremely rare cases where services are down for extended periods and local buffers fill.
Network Efficiency: Batching reduces network calls by 90% compared to sending logs individually. This lowers bandwidth costs and reduces load on your processing servers.
Docker Deployment
For production-like testing, deploy everything with Docker:
docker-compose up --build
This launches five containers:
Dashboard server (port 5000)
Python demo client
Java demo client
Node.js demo client
.NET demo client
All demo clients connect to the dashboard and send test logs continuously. You can observe the complete multi-language integration working together.
Troubleshooting Common Issues
Import Errors in Python: Make sure your virtual environment is activated and PYTHONPATH includes the library directory:
source venv/bin/activate
export PYTHONPATH=”$(pwd):$PYTHONPATH”
Dashboard Connection Failures: Verify the dashboard is running and no other process is using port 5000:
lsof -i :5000
# If something’s there, kill it or change the dashboard port
Logs Not Appearing: Check the endpoint URL in your configuration matches where the dashboard is running. Verify network connectivity between client and dashboard.
What You’ve Accomplished
You’ve built production-ready infrastructure that major companies rely on daily. Your client libraries implement the same patterns used by:
Netflix for logging across their polyglot microservices architecture
Stripe for collecting payment processing logs from multiple language SDKs
Uber for aggregating ride data from mobile apps and backend services
GitHub for centralizing logs from Ruby, Go, and JavaScript services
The skills you developed today transfer directly to professional environments:
Cross-Language API Design - Creating consistent interfaces across different programming paradigms
Asynchronous Processing - Non-blocking operations that keep applications responsive
Connection Resilience - Handling network failures gracefully with retries and backoffs
Production Monitoring - Real-time observability into distributed system behavior
Assignment: Extend to Go
Challenge: Create a logging client for Go that integrates with your existing dashboard.
Requirements:
Implement the same unified API (
Info(),Error(),Warning(), etc.)Add batching with configurable size and time triggers
Include retry logic with exponential backoff
Make it appear correctly in the dashboard’s language detection
Write examples demonstrating usage
Hints for Implementation:
Go’s concurrency model with goroutines maps naturally to your async architecture. Use channels to communicate between the main goroutine and background workers. The net/http package provides HTTP client functionality.
Structure your code similar to the other libraries:
logger.go- Main logger implementationmodels.go- Data structures (LogEntry, LogBatch)config.go- Configuration loadingexamples/- Usage demonstrations
Success Metrics: Your Go library should achieve similar performance (1000+ logs/sec), use similar memory (<50MB), and integrate seamlessly with the existing dashboard without requiring dashboard code changes.
Looking Forward
Tomorrow you’ll build structured logging helpers that make these libraries even easier to use. You’ll add log templates, automatic field extraction, and framework-specific integrations for popular web frameworks.
The foundation you built today - client libraries that provide universal, reliable logging - enables every application in your organization to participate in centralized log processing with minimal developer effort.
Next: Day 129 - Implement Structured Logging Helpers