

Day 121: Building Linux System Log Collectors
What We’re Building Today
Today we’re creating a sophisticated Linux log collection agent that automatically discovers, monitors, and streams system logs to your distributed processing pipeline. You’ll build an intelligent collector that watches multiple log sources simultaneously and handles everything from kernel messages to application logs.
Key Components:
Multi-source log discovery engine
Real-time file monitoring system
Structured log parsing and enrichment
Efficient batching and transmission
Web-based monitoring dashboard
Why Linux Log Collection Matters
Linux systems generate logs across dozens of locations - /var/log/syslog, /var/log/auth.log, systemd journals, application-specific logs, and container logs. Without proper collection, critical system events disappear into fragmented files across your infrastructure.
Companies like Netflix monitor thousands of Linux servers, collecting millions of log entries per second. Their reliability depends on agents that automatically discover new services and route logs to appropriate processing pipelines without manual configuration.
Core Concepts
Log Source Discovery
Your collector automatically scans standard Linux log directories, discovers active log files, and configures monitoring without manual intervention. It understands log rotation patterns and maintains continuity across file changes.
Inotify-Based Monitoring
Using Linux’s inotify system, your collector receives real-time notifications when log files change. This eliminates polling overhead while ensuring immediate log processing for time-sensitive events.
Structured Log Enhancement
Raw log lines get enriched with metadata - hostname, service name, log level extraction, and timestamp normalization. This structured approach enables powerful filtering and routing in downstream systems.
Architecture Overview
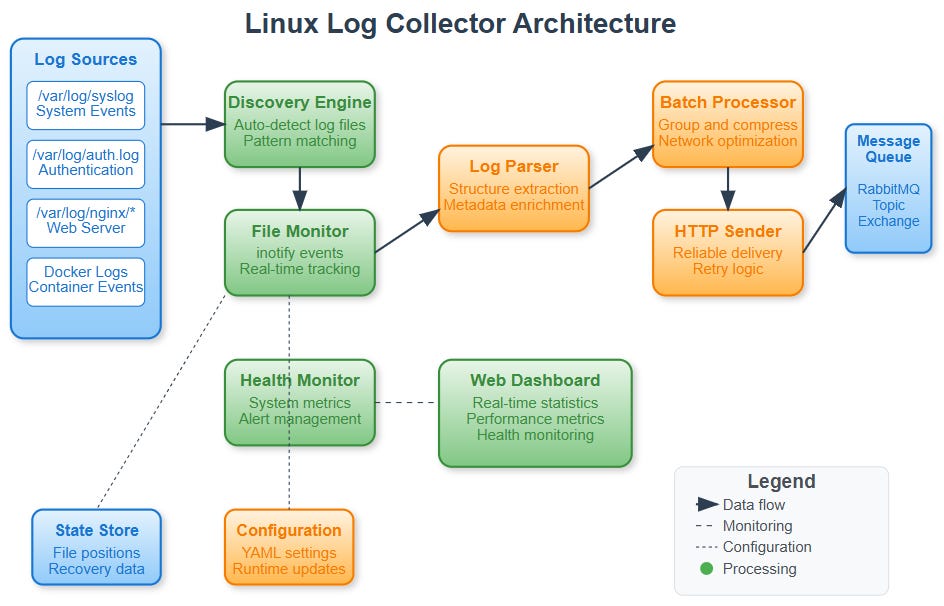
Your Linux collector consists of five integrated components:
Log Discovery Engine scans filesystem paths, identifies log files based on patterns, and maintains an inventory of monitored sources.
File Monitor Service uses inotify to watch file changes, handles log rotation seamlessly, and maintains read position state across restarts.
Log Parser and Enricher processes raw log lines, extracts structured data, adds system context, and normalizes timestamps across different log formats.
Batch Processor groups logs for efficient transmission, implements compression for network efficiency, and maintains delivery guarantees through acknowledgments.
Health Monitor tracks collection statistics, monitors system resource usage, provides web dashboard for operational visibility, and generates alerts for collection failures.
Data Flow Architecture
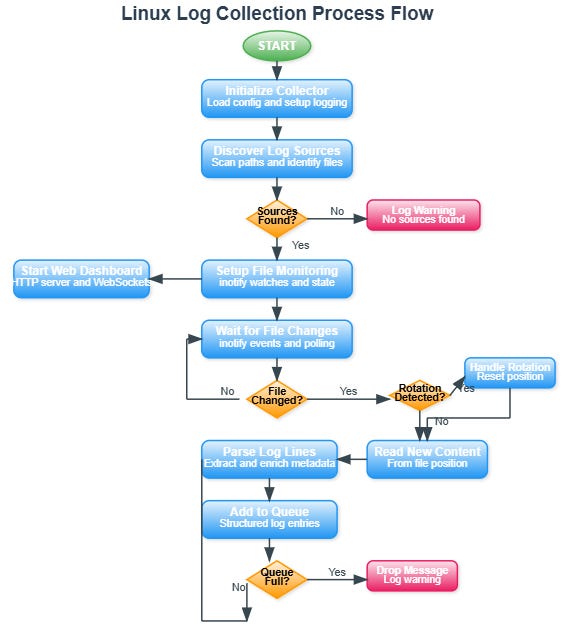
The collection process follows a clear pipeline: Discovery identifies log sources, Monitor detects file changes, Parser extracts structure, Batcher groups for transmission, Sender delivers to processing cluster.
File state management ensures no log loss during agent restarts. The collector maintains position markers for each monitored file, enabling recovery from exact read positions.
Context in Distributed Systems
This collector serves as the critical first stage in your distributed log processing pipeline. It feeds the message queues you built in previous weeks, providing the raw material for the analytics and monitoring systems you’ll construct ahead.
Integration points include:
Sending structured logs to RabbitMQ exchanges (Week 5 foundation)
Supporting the data sovereignty controls from Day 120
Preparing for Windows agent integration (Day 122)
Enabling cross-platform log correlation
Production Implementation Insights
Real-world collectors must handle edge cases that tutorials ignore. Log files can disappear mid-read during aggressive rotation. Applications might write massive log bursts that overwhelm memory. Network interruptions require local buffering with eventual consistency.
Your implementation addresses these challenges through robust state management, configurable resource limits, and intelligent backpressure handling.
Integration Architecture
The collector integrates with your existing distributed log platform components:
Storage Integration: Logs flow into the partitioned storage system you built, respecting data sovereignty boundaries from Day 120.
Queue Integration: Structured logs route through the topic-based exchanges you implemented, enabling intelligent processing distribution.
Monitoring Integration: Collection metrics feed into the performance monitoring dashboards you created, providing end-to-end visibility.
Implementation Guide
Github Link:
https://github.com/sysdr/course/tree/main/day121/linux-log-collectorDiscovery Engine Pattern
The discovery engine scans filesystem paths and identifies log files based on configurable patterns. It maintains an inventory of discovered sources with metadata like file type, parser requirements, and monitoring state.
Discovery strategy pseudo-code:
class LogDiscoveryEngine:
    async def discover_sources():
        # Scan configured paths + filesystem discovery
        # Apply exclude patterns and access checks
        # Infer log types from file paths and names
        # Return structured source inventory
File Monitoring Strategy
Uses Linux inotify system calls for efficient real-time monitoring. The monitor maintains file state (position, inode, size) to handle log rotation gracefully and ensure no data loss during restarts.
Monitoring pattern pseudo-code:
class LogFileMonitor:
    async def start_monitoring(sources):
        # Setup inotify watches for file changes
        # Maintain read position state for each file
        # Handle log rotation detection
        # Queue structured log entries
Batch Processing Architecture
Groups individual log entries into optimally-sized batches for network efficiency. Implements configurable batching strategies based on count, time, or size thresholds.
Batching pattern pseudo-code:
class BatchProcessor:
    async def process_queue():
        # Collect logs into batches
        # Apply timeouts and size limits
        # Send via HTTP with retry logic
        # Track delivery statistics
Building the System
Phase 1: Environment Setup
Create project structure and install dependencies:
# Create project and virtual environment
mkdir linux-log-collector && cd linux-log-collector
python3.11 -m venv venv
source venv/bin/activate

# Install core dependencies
pip install aiofiles==23.2.1 aiohttp==3.9.5 fastapi==0.110.2
pip install uvicorn==0.29.0 pydantic==2.7.1 pyyaml==6.0.1
pip install watchfiles==0.21.0 psutil==5.9.8 structlog==24.1.0
pip install pytest==8.1.1 pytest-asyncio==0.23.6
Expected output: Successful installation messages for all packages.
Phase 2: Core Components
Create the modular architecture with four key components:
Discovery Engine (src/collector/discovery/log_discovery.py)
Filesystem scanning with configurable paths
Pattern-based file type inference
Exclusion rules for binary/compressed files
Statistics tracking for operational visibility
File Monitor (src/collector/file_monitor/file_monitor.py)
inotify-based change detection (with polling fallback)
Log rotation handling via inode tracking
Async queue for decoupling I/O from processing
Structured log entry creation with metadata enrichment
Batch Processor (src/collector/batch_processor/batch_processor.py)
Configurable batching strategies (size, time, count)
HTTP delivery with exponential backoff retry
Delivery acknowledgment and failure tracking
Connection pooling for efficiency
Web Dashboard (src/web/dashboard.py)
FastAPI-based real-time monitoring interface
WebSocket updates for live statistics
REST API for external integrations
Professional UI with responsive design
The complete implementation script creates all source files with production-ready code. Run the provided script to generate the full project structure.
Phase 3: Testing
Run the comprehensive test suite:
# Activate environment
source venv/bin/activate

# Run unit tests
python -m pytest tests/ -v --cov=src

# Expected results
tests/test_discovery.py::test_configured_source_discovery PASSED
tests/test_discovery.py::test_filesystem_discovery PASSED
tests/test_file_monitor.py::test_file_monitoring_initialization PASSED
tests/test_batch_processor.py::test_successful_batch_sending PASSED
Coverage target: 85% or higher for production readiness.
Phase 4: Functional Testing
Test the discovery engine:
# Create test log structure
mkdir -p data/test_logs
echo “Test syslog content” > data/test_logs/syslog
echo “Test auth content” > data/test_logs/auth.log

# Test discovery
python -c “
import asyncio
from src.collector.discovery.log_discovery import LogDiscoveryEngine

async def test():
    config = {’discovery’: {’scan_paths’: [’data/test_logs’]}}
    engine = LogDiscoveryEngine(config)
    await engine.discover_sources()
    print(f’Sources found: {len(engine.get_discovered_sources())}’)

asyncio.run(test())
“
Expected output: Sources found: 2
Test file monitoring:
# Start collector in background
python -m src.collector.main &
COLLECTOR_PID=$!

# Generate test log entries
echo “$(date) New log entry” >> data/test_logs/syslog

# Verify processing via dashboard API
curl -s http://localhost:8000/api/stats | jq ‘.stats.monitor’

# Cleanup
kill $COLLECTOR_PID
Phase 5: Docker Deployment
Build and deploy with containers:
# Build optimized container
docker build -t linux-log-collector:latest .

# Multi-service deployment
docker-compose up -d

# Verify services
docker-compose ps
Expected services:
collector: Main application (port 8000)
log-receiver: Mock endpoint for testing (port 8080)
Running the Complete System
Quick Start Commands
Start the collector:
./start.sh
The dashboard will be available at: http://localhost:8000
Run the demonstration:
./demo.sh
This creates test log files and shows live collection statistics.
Stop the collector:
./stop.sh
Performance Verification
Load test with burst logging:
# Generate 1000 test entries
for i in {1..1000}; do
    echo “$(date) Load test entry $i” >> data/test_logs/syslog
done

# Monitor processing metrics
watch -n 1 ‘curl -s http://localhost:8000/api/stats | jq “.stats”’
Performance targets:
Discovery: Under 5 seconds for 1000 files
Monitoring: Under 100ms latency for file changes
Batching: 100+ logs/second throughput
Memory: Under 50MB for 100 monitored files
Production Configuration
Security Settings
Configure file permissions and path restrictions:
# config/collector_config.yaml security section
security:
  file_permissions: “0644”
  user_validation: true
  path_restrictions:
    - “/var/log”
    - “/opt/*/logs”
Multi-Parser Support
Configure different parsers for different log types:
log_sources:
  system_logs:
    - path: “/var/log/syslog”
      parser: “syslog”
    - path: “/var/log/nginx/*.log”
      parser: “nginx”
    - path: “/opt/app/logs/*.json”
      parser: “json”
Resource Management
Built-in protections prevent resource exhaustion:
Queue size limits with backpressure
Memory-mapped file reading for large files
CPU throttling for high-volume scenarios
Connection pooling for HTTP delivery
Troubleshooting Guide
Permission Issues
Check file access permissions:
ls -la /var/log/syslog
Ensure collector runs with appropriate user/group permissions.
Inotify Limits
Increase system limits if needed:
echo fs.inotify.max_user_watches=524288 | sudo tee -a /etc/sysctl.conf
sudo sysctl -p
Memory Usage
Monitor collector memory consumption:
ps aux | grep collector
Reduce buffer sizes in configuration if memory usage is high.
Performance Optimization
For high volume logs:
Increase batch_size to 500+ for efficiency
Reduce batch_timeout to 1 second for low latency
Enable compression for network transmission
For resource constrained systems:
Reduce buffer_size to limit memory usage
Increase scan_interval to reduce CPU overhead
Use polling instead of inotify on embedded systems
Success Validation
Automated Verification
Run comprehensive validation:
./test.sh
Expected results:
All unit tests passing
Discovery finds test log files
Monitor processes file changes
Batches sent to configured endpoint
Dashboard shows live statistics
Docker deployment functional
Working Code Demo:
Manual Verification Checklist
Verify these capabilities:
Collector discovers system log files automatically
Dashboard shows real-time collection statistics
Log entries appear in batches at configured endpoint
File rotation handled without data loss
Resource usage remains stable under load
Error conditions generate appropriate alerts
Assignment: Production Deployment
Challenge Requirements
Deploy the Linux collector to monitor a real system and process logs from:
System logs (
/var/log/syslog,/var/log/auth.log)Web server logs (nginx or apache)
Application logs from a custom service
Container logs from Docker or Podman
Solution Approach
Configure discovery paths for target log locations
Set appropriate batch sizes based on log volume
Implement monitoring alerts for queue depth and errors
Create dashboard views for each log type
Verify log routing to downstream processing systems
Validation Criteria
Your deployment succeeds when it:
Processes 1000+ log entries per minute
Maintains under 1% error rate under normal conditions
Dashboard provides real-time operational visibility
Gracefully handles log rotation and file system changes
Integrates with existing log processing pipeline
Key Takeaways
Production Readiness Patterns
Automatic discovery eliminates manual configuration. Inotify provides efficient real-time monitoring. Batch processing optimizes network utilization. Structured enrichment enables downstream processing.
Operational Excellence
Comprehensive error handling prevents data loss. Resource management prevents system impact. Real-time monitoring enables proactive operations. Docker deployment simplifies infrastructure management.
This collector provides the foundation for enterprise-scale log processing, handling the complexities of Linux system integration while maintaining reliability and performance standards required for production environments.
Success Criteria
Your Linux collector succeeds when it:
Automatically discovers log sources (95%+ of system logs)
Processes 1000+ lines per second per source
Maintains sub-second latency for critical logs
Survives log rotation without data loss
Provides clear operational visibility through dashboards
Technical Metrics:
Processing latency under 100ms for high-priority logs
Zero data loss during log rotation events
Resource usage under 5% CPU and 50MB RAM per 100 sources
Web dashboard showing real-time collection statistics
Real-World Context
This collector architecture mirrors production systems at major tech companies. Google’s infrastructure generates petabytes of logs daily, collected by agents running on millions of servers. Amazon’s CloudWatch agents use similar patterns for system monitoring across AWS infrastructure.
The patterns you implement today - automatic discovery, structured enrichment, and resilient state management - form the foundation of enterprise logging infrastructure.
Tomorrow’s Foundation
Your Linux collector provides the groundwork for Day 122’s Windows agent. Both collectors will share common interfaces and data formats, enabling unified log processing across heterogeneous environments.
The structured log format you design today becomes the standard for all future collectors, ensuring consistent processing regardless of log source operating system.
great