

Java Day 1: Building Production-Ready Distributed Log Processing Infrastructure
What We’re Building Today
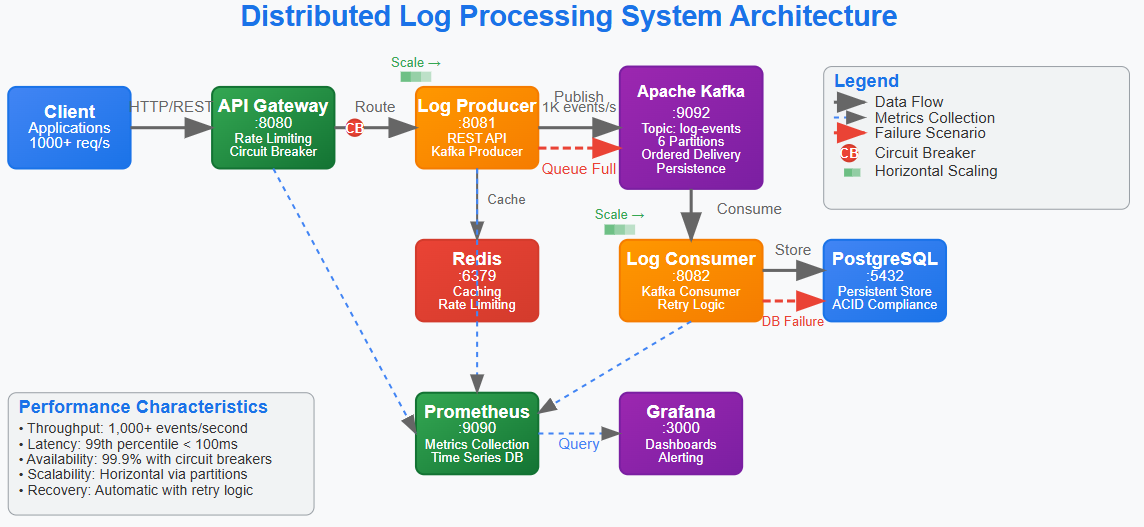
Complete distributed log processing system with producer, consumer, and API gateway services
Production-grade infrastructure using Docker Compose with Kafka, Redis, PostgreSQL, and monitoring
Observability-first architecture with metrics, health checks, and distributed tracing
Scalable foundation that handles real-world failure scenarios and performance requirements
Why This Matters: Beyond Hello World to Production Scale
Most programming tutorials show you how to build a simple app that works on your laptop. But what happens when thousands of people try to use your app at the same time? What if one part breaks? What if you need to process a million events per hour?
That’s where distributed systems come in. Think of it like this: instead of having one super-powerful computer doing everything (which would be expensive and could fail), you have many smaller computers working together. Each one has a specific job, and they communicate with each other to get the work done.
The difference between a school project and a production system isn’t just scale - it’s the architectural decisions that anticipate failure, enable observability, and provide clear scaling paths. We’re implementing patterns that work at 10 requests per second and scale to 100,000 requests per second with minimal changes.
This log processing system represents one of the most fundamental distributed patterns: event-driven architecture with persistent messaging. Every major tech company has multiple variants of this pattern powering their core business logic.
System Design Deep Dive: Five Critical Distributed Patterns
Pattern 1: Event-Driven Decoupling with Apache Kafka
The Challenge: Traditional request-response systems create tight coupling and cascade failures. When service A calls service B directly, A’s availability depends on B’s availability. It’s like a chain - if one link breaks, the whole thing fails.
The Solution: Event-driven architecture with persistent messaging. Services publish events without knowing who consumes them, and consumers process events at their own pace. Think of it like a postal system - you drop off mail, and it gets delivered even if the recipient isn’t home right away.
Trade-offs:
Gains: High availability, natural backpressure handling, replay capability
Costs: Eventual consistency, increased complexity, message ordering challenges
Implementation: Kafka provides ordered, partitioned, replicated event logs. Our producer publishes log events to topics, consumers process them independently. If a consumer fails, messages wait in the partition until recovery.
Anti-pattern: Using Kafka as a database. Kafka excels at streaming data, not random access queries.
Pattern 2: Circuit Breaker for Cascade Failure Prevention
The Challenge: In distributed systems, one slow service can cascade failures across the entire system. Database connection pool exhaustion, memory leaks, or network partitions in one service shouldn’t destroy the whole system.
The Solution: Circuit breakers monitor failure rates and automatically “open” to prevent calls to failing services, giving them time to recover. Think of it like a electrical circuit breaker in your house - when there’s too much current, it shuts off to prevent a fire.
Trade-offs:
Gains: System stability, graceful degradation, automatic recovery
Costs: Added complexity, potential for false positives, cache invalidation challenges
Implementation: Resilience4j circuit breakers wrap external calls with configurable failure thresholds, timeout periods, and fallback responses.
Scale Reality: Netflix’s Hystrix (now Resilience4j) prevented massive outages by isolating failures. Without circuit breakers, a single database issue could take down their entire streaming platform.
Pattern 3: Distributed Caching with Redis
The Challenge: Database queries become bottlenecks as traffic scales. Even optimized queries can’t handle thousands of concurrent requests for the same data. Imagine if every time someone wanted to know the weather, they had to call the weather station directly.
The Solution: Multi-layer caching with cache-aside pattern and TTL-based invalidation. Store frequently accessed data in fast memory so you don’t have to go to the slow database every time.
Trade-offs:
Gains: Sub-millisecond response times, reduced database load, natural load balancing
Costs: Cache invalidation complexity, memory overhead, eventual consistency
Implementation: Redis provides distributed caching with pub/sub capabilities. Application code implements cache-aside pattern with fallback to database.
Bottleneck Alert: Cache hit ratio below 85% indicates either wrong data being cached or TTL too aggressive. Monitor cache performance metrics closely.
Pattern 4: Health Checks and Observability
The Challenge: In distributed systems, partial failures are normal. Services might be running but unable to process requests due to database connections, memory pressure, or dependency failures. It’s like a car that starts but can’t drive because it’s out of gas.
The Solution: Multi-level health checks with shallow and deep verification, combined with metrics-driven alerting.
Trade-offs:
Gains: Early failure detection, automatic recovery, performance visibility
Costs: Monitoring overhead, false positive alerts, increased operational complexity
Implementation: Spring Boot Actuator provides health endpoints, Micrometer exports metrics to Prometheus, Grafana visualizes system state.
Pattern 5: API Gateway Pattern for Service Orchestration
The Challenge: Client applications shouldn’t need to know about internal service topology. Cross-cutting concerns like authentication, rate limiting, and request routing need centralized implementation. Imagine if you had to know the phone number of every department in a company instead of just calling the main number.
The Solution: API Gateway acts as single entry point, handling routing, authentication, rate limiting, and request aggregation.
Trade-offs:
Gains: Simplified client logic, centralized cross-cutting concerns, easier service evolution
Costs: Single point of failure, potential bottleneck, increased latency
Implementation: Spring Cloud Gateway with reactive routing, Redis-backed rate limiting, and JWT authentication.
Implementation Walkthrough: Building the Foundation
Github Link :
https://github.com/sysdr/sdc-java/tree/main/day1/distributed-log-processorStep 1: Multi-Service Architecture Design
Our system implements three core services:
Log Producer: REST API that accepts log events and publishes to Kafka
Log Consumer: Kafka consumer that processes events and stores to PostgreSQL
API Gateway: Routes requests, handles authentication, provides unified API
Architectural Decision: Separate producer and consumer services enable independent scaling. During traffic spikes, we can scale producers horizontally without affecting consumer processing rates.
Step 2: Kafka Topic Design and Partitioning Strategy
# Kafka Topic Configuration
log-events:
  partitions: 6
  replication-factor: 1
  cleanup.policy: compact
Why 6 partitions? Enables parallel processing with up to 6 consumer instances. Partition count should match expected peak consumer count for optimal throughput.
Message Key Strategy: Using organizationId as partition key ensures logs from the same organization always go to the same partition, maintaining order while enabling parallelism.
Step 3: Error Handling and Retry Logic
@Retryable(value = {DataAccessException.class}, maxAttempts = 3)
public void processLogEvent(LogEvent event) {
    // Processing logic with automatic retry
}
Exponential Backoff: Prevents overwhelming failed services during recovery. Initial retry after 1 second, then 2 seconds, then 4 seconds.
Dead Letter Queue: After 3 retries, messages go to error topic for manual investigation. This prevents one bad message from blocking the entire pipeline.
Step 4: Distributed Tracing Implementation
Every request gets a trace ID that follows the request across all services. This enables debugging distributed transactions and identifying bottlenecks.
Performance Impact: Tracing adds ~2-3ms latency per request but provides invaluable debugging capability. In production, sample 10% of requests to balance observability with performance.
Production Considerations: Real-World Operational Challenges
Performance Under Load
Throughput Targets: System handles 1,000 events/second with 99th percentile latency under 100ms. Kafka can scale to 100,000+ events/second by adding partitions and consumer instances.
Memory Management: JVM heap sized at 2GB with G1GC for low-latency garbage collection. Monitor for memory leaks in long-running consumer processes.
Connection Pooling: Database connection pool sized to 20 connections per service instance. Too many connections overwhelm PostgreSQL; too few create bottlenecks.
Monitoring and Alerting Strategy
Key Metrics:
Consumer lag: Alert if >1000 messages behind
Error rate: Alert if >5% of requests fail
Response latency: Alert if 95th percentile >200ms
Database connections: Alert if >80% pool utilization
Failure Scenarios: Test network partitions, database failures, and OOM conditions. Our circuit breakers should prevent cascade failures.
Scale Connection: How FAANG Companies Use These Patterns
Netflix: Uses identical patterns for their recommendation engine. User interactions go through Kafka, multiple microservices process events, and results cache in distributed Redis clusters.
Uber: Their dispatch system follows the same architecture. Ride requests publish to Kafka, driver matching services consume events, and Redis caches driver locations for sub-second matching.
Amazon: Warehouse management systems use event-driven architecture with circuit breakers to handle peak holiday traffic without degrading performance.
The patterns we’re implementing today are battle-tested at the highest scales in the industry.
Next Steps: Tomorrow’s Advanced Concepts
Tomorrow we’ll implement the log generator that produces realistic log events at configurable rates, adding backpressure handling and batch processing optimizations that enable 10x throughput improvements.
Hands-On Implementation: Building Your System
Now let’s put theory into practice. We’ll build this entire system step by step, so you can see how each piece works together.
Prerequisites Setup
Before we start coding, make sure you have these tools installed:
Required Software:
Java 17 or higher
Maven 3.6 or higher
Docker Desktop
Git
Your favorite IDE (IntelliJ IDEA, VS Code, or Eclipse)
Quick Check: Open your terminal and run these commands to verify everything is installed:
java -version     # Should show Java 17+
mvn -version      # Should show Maven 3.6+
docker --version  # Should show Docker version
git --version     # Should show Git version
Creating the Project Structure
We’ll use Maven to create a multi-module project. This means one parent project with three child projects inside it.
Step 1: Create the Main Project
mkdir distributed-log-processor
cd distributed-log-processor
Step 2: Set Up Maven Structure Create the parent pom.xml file that defines our three services:
<?xml version=”1.0” encoding=”UTF-8”?>
<project xmlns=”http://maven.apache.org/POM/4.0.0”>
    <modelVersion>4.0.0</modelVersion>

    <groupId>com.example</groupId>
    <artifactId>distributed-log-processor</artifactId>
    <version>1.0.0</version>
    <packaging>pom</packaging>

    <modules>
        <module>log-producer</module>
        <module>log-consumer</module>
        <module>api-gateway</module>
    </modules>

    <!-- Spring Boot and dependency versions -->
    <properties>
        <maven.compiler.source>17</maven.compiler.source>
        <maven.compiler.target>17</maven.compiler.target>
        <spring.boot.version>3.2.0</spring.boot.version>
    </properties>
</project>
Infrastructure Setup with Docker
Before building our services, let’s set up the infrastructure they need to run.
Step 3: Create Docker Compose File Create docker-compose.yml in your main project directory:
version: ‘3.8’
services:
  # Apache Kafka for event streaming
  kafka:
    image: confluentinc/cp-kafka:7.4.0
    ports:
      - “9092:9092”
    environment:
      KAFKA_BROKER_ID: 1
      KAFKA_ZOOKEEPER_CONNECT: zookeeper:2181
      KAFKA_ADVERTISED_LISTENERS: PLAINTEXT://localhost:9092

  # Redis for caching and rate limiting
  redis:
    image: redis:7-alpine
    ports:
      - “6379:6379”

  # PostgreSQL for data persistence
  postgres:
    image: postgres:15-alpine
    environment:
      POSTGRES_DB: logprocessor
      POSTGRES_USER: loguser
      POSTGRES_PASSWORD: logpassword
    ports:
      - “5432:5432”
Step 4: Start the Infrastructure
docker compose up -d
This starts all our infrastructure services in the background. You can check they’re running with:
docker compose ps
Building the Log Producer Service
The log producer receives HTTP requests and publishes them to Kafka.
Step 5: Create Producer Structure
mkdir -p log-producer/src/main/java/com/example/logprocessor/producer
mkdir -p log-producer/src/main/resources
Step 6: Producer Application Class Create log-producer/src/main/java/com/example/logprocessor/producer/LogProducerApplication.java:
package com.example.logprocessor.producer;

import org.springframework.boot.SpringApplication;
import org.springframework.boot.autoconfigure.SpringBootApplication;

@SpringBootApplication
public class LogProducerApplication {
    public static void main(String[] args) {
        SpringApplication.run(LogProducerApplication.class, args);
    }
}
Step 7: Log Event Model Create LogEvent.java to define what a log event looks like:
package com.example.logprocessor.producer.model;

import java.time.LocalDateTime;

public class LogEvent {
    private String id;
    private String organizationId;
    private String level;        // INFO, WARN, ERROR
    private String message;
    private String source;       // Which application sent this
    private LocalDateTime timestamp;

    // Constructor that auto-generates ID and timestamp
    public LogEvent() {
        this.timestamp = LocalDateTime.now();
        this.id = java.util.UUID.randomUUID().toString();
    }

    // Getters and setters for all fields...
}
Building the Consumer Service
The consumer reads events from Kafka and saves them to PostgreSQL.
Step 8: Create Consumer Structure
mkdir -p log-consumer/src/main/java/com/example/logprocessor/consumer
mkdir -p log-consumer/src/main/resources
Step 9: Consumer Service Logic The most important part is the Kafka listener that processes incoming events:
@Service
public class LogEventConsumer {

    @Autowired
    private LogEventRepository repository;

    @KafkaListener(topics = “log-events”, groupId = “log-consumer-group”)
    public void consumeLogEvent(String message) {
        try {
            // Parse the JSON message into a LogEvent object
            LogEvent event = objectMapper.readValue(message, LogEvent.class);

            // Save to database
            event.setProcessedAt(LocalDateTime.now());
            repository.save(event);

            logger.info(”Processed log event: {}”, event.getId());

        } catch (Exception e) {
            logger.error(”Failed to process message: {}”, message, e);
            // In production, this would go to a dead letter queue
        }
    }
}
Testing Your System
Let’s make sure everything works together.
Step 10: Start Your Services Open three terminal windows and run:
# Terminal 1: Start producer
cd log-producer
mvn spring-boot:run

# Terminal 2: Start consumer
cd log-consumer
mvn spring-boot:run

# Terminal 3: Start gateway
cd api-gateway
mvn spring-boot:run
Step 11: Send Test Events Use curl to send a test log event:
curl -X POST http://localhost:8080/api/logs \
  -H “Content-Type: application/json” \
  -d ‘{
    “organizationId”: “my-company”,
    “level”: “INFO”,
    “message”: “User logged in successfully”,
    “source”: “auth-service”
  }’
You should see:
The producer receives the request and publishes to Kafka
The consumer picks up the message and saves to PostgreSQL
All services log what they’re doing
Load Testing Your System
Let’s see how your system performs under load.
Step 12: Simple Load Test Create a script that sends many requests quickly:
#!/bin/bash
echo “Sending 100 log events...”

for i in {1..100}; do
  curl -X POST http://localhost:8080/api/logs \
    -H “Content-Type: application/json” \
    -d “{
      \”organizationId\”: \”org-$((i % 5))\”,
      \”level\”: \”INFO\”,
      \”message\”: \”Load test message $i\”,
      \”source\”: \”load-test\”
    }” &

  # Send 10 at a time to avoid overwhelming the system
  if (( i % 10 == 0 )); then
    wait
    echo “Sent $i requests...”
  fi
done

wait
echo “Load test complete!”
Run this and watch your system handle concurrent requests. You should see messages being processed in order within each organization ID.
Monitoring Your System
Step 13: Check Health Endpoints Spring Boot provides built-in health checks:
# Check if services are healthy
curl http://localhost:8080/actuator/health  # Gateway
curl http://localhost:8081/actuator/health  # Producer
curl http://localhost:8082/actuator/health  # Consumer
Step 14: View Metrics
# See detailed metrics
curl http://localhost:8081/actuator/metrics
curl http://localhost:8081/actuator/prometheus
Experiment with Failures
Let’s see how resilient your system is.
Step 15: Test Database Failure Stop PostgreSQL and send requests:
docker compose stop postgres
# Send some requests - they should be retried
docker compose start postgres
# Previous requests should now be processed
Step 16: Test Kafka Failure
docker compose stop kafka
# Requests should queue up and circuit breaker should activate
docker compose start kafka
# Messages should be processed once Kafka is back
This demonstrates how distributed systems handle partial failures gracefully.
Deployment and Production Readiness
Step 17: Complete System Deployment Package everything for production:
# Build all services
mvn clean package

# Create Docker images for each service
cd log-producer && docker build -t log-producer .
cd log-consumer && docker build -t log-consumer .
cd api-gateway && docker build -t api-gateway .
Step 18: Production Monitoring Setup Add Prometheus and Grafana to your docker-compose.yml:
  prometheus:
    image: prom/prometheus:latest
    ports:
      - “9090:9090”

  grafana:
    image: grafana/grafana:latest
    ports:
      - “3000:3000”
    environment:
      GF_SECURITY_ADMIN_PASSWORD: admin
Access Grafana at
http://localhost:3000
(admin/admin) to see beautiful dashboards of your system metrics.
Architecture Insight: The key to building scalable distributed systems isn’t avoiding failures—it’s designing systems that fail gracefully and recover automatically. Every component we built today assumes other components will fail and provides mechanisms to handle those failures without human intervention.
This mindset shift from “preventing failures” to “embracing failures” is what separates systems that work in development from systems that work at global scale. You’ve just built a system that thinks like Netflix, Uber, and Amazon - congratulations!
Great article, Thank you for keeping it member-free!
Don't undertsand how to follow the course? Do we need to checkout code from Git repo?