
Week 2 : Build Integrated Distributed Logging Pipeline(TCP, UDP, Batching, Compression, TLS)
A practical lesson on building a distributed logging pipeline: TCP/UDP, batching, compression, TLS, dashboards, and load testing—packaged as one runnable stack.
This repo is a single, runnable “integrated lessons” built from day8 through day14 of a distributed logging course. The important bit isn’t that there are many folders—it’s that the repo now behaves like a small, realistic logging platform:
Producers (shippers/clients) generate logs and push them over the network.
Receivers (servers) ingest logs and persist them (typically to files).
A dashboard lets you check system health and high‑level metrics.
Transport and efficiency features (UDP, batching, compression, TLS) are treated as operational choices you can toggle.
A load generator stress-tests the ingestion path so you can see failure modes early.
The “merged” part is implemented in a clean, pragmatic way:
legacy/holds the original projects (kept largely intact).apps/contains thin entrypoints that set the right working directory /PYTHONPATHand then run the legacy implementations.libs/is the shared layer (config + protocol helpers) used by the merged stack and tests.docker/docker-compose.ymlspins up a full demo environment with non-conflicting ports.
What you’ll learn (and why it matters)
By the end, you should be able to reason about:
TCP vs UDP ingestion: reliability/ordering vs speed/overhead.
Batching: trading latency for throughput and fewer syscalls.
Compression: paying CPU to reduce network and disk pressure.
TLS: encrypting log transport and making “internal traffic” safer by default.
Observability: a dashboard and stats endpoints that tell you if the system is alive.
Load testing: validating assumptions under pressure (before production does it for you).
The merged system, at a glance
In Docker Compose, different services run the same image but execute different apps/<role>/main.py entrypoints. Those entrypoints then call into legacy code while keeping paths and environment stable.
Diagram 1 — Architecture
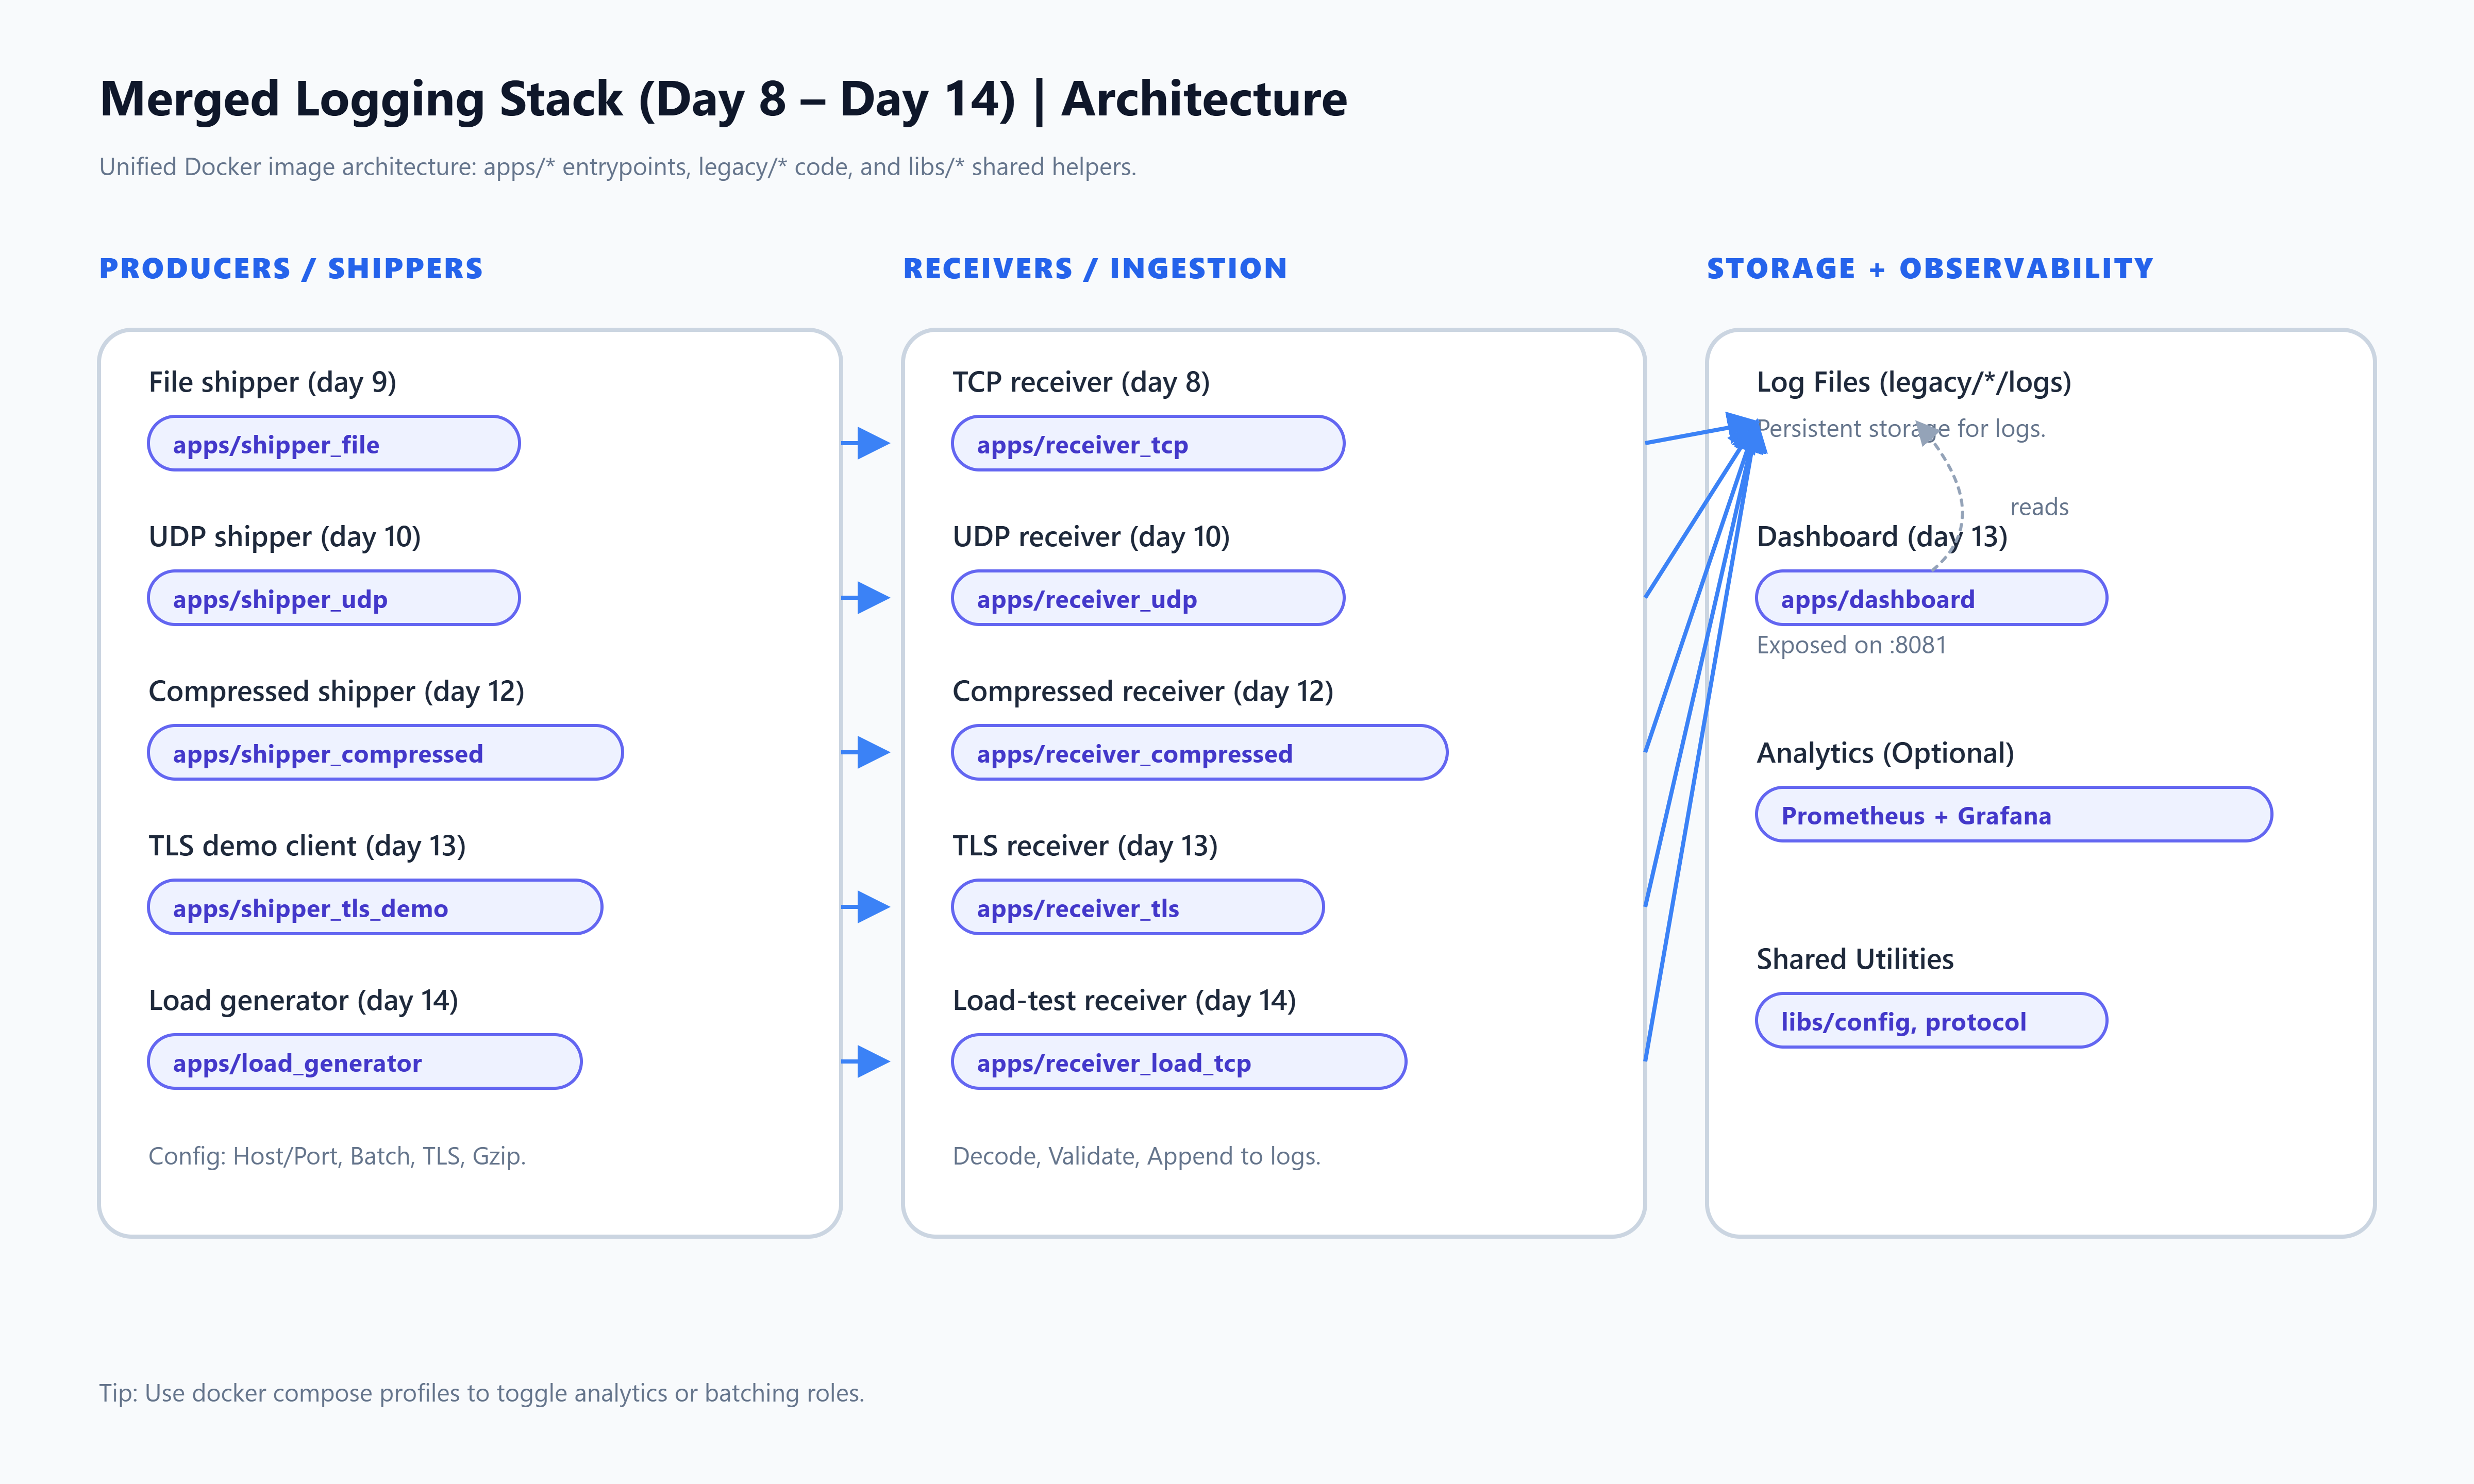
What to notice:
Multiple ingestion “lanes” exist at once (TCP, UDP, compressed TCP, TLS).
The TLS lane includes a dashboard that reads the same log directory the TLS receiver writes.
The day14 lane is intentionally “test-first”: a receiver + a load generator that can saturate it.
Data flow and control flow
Most lanes follow the same shape:
A shipper reads or generates log events.
The shipper encodes them (framing/serialization; sometimes batching).
The shipper sends to a receiver (TCP/UDP/TLS).
The receiver validates/decodes and appends to storage (files in
legacy/.../logs).Optional: the dashboard exposes health and summary stats.
Diagram 2 — Sequence / data flow
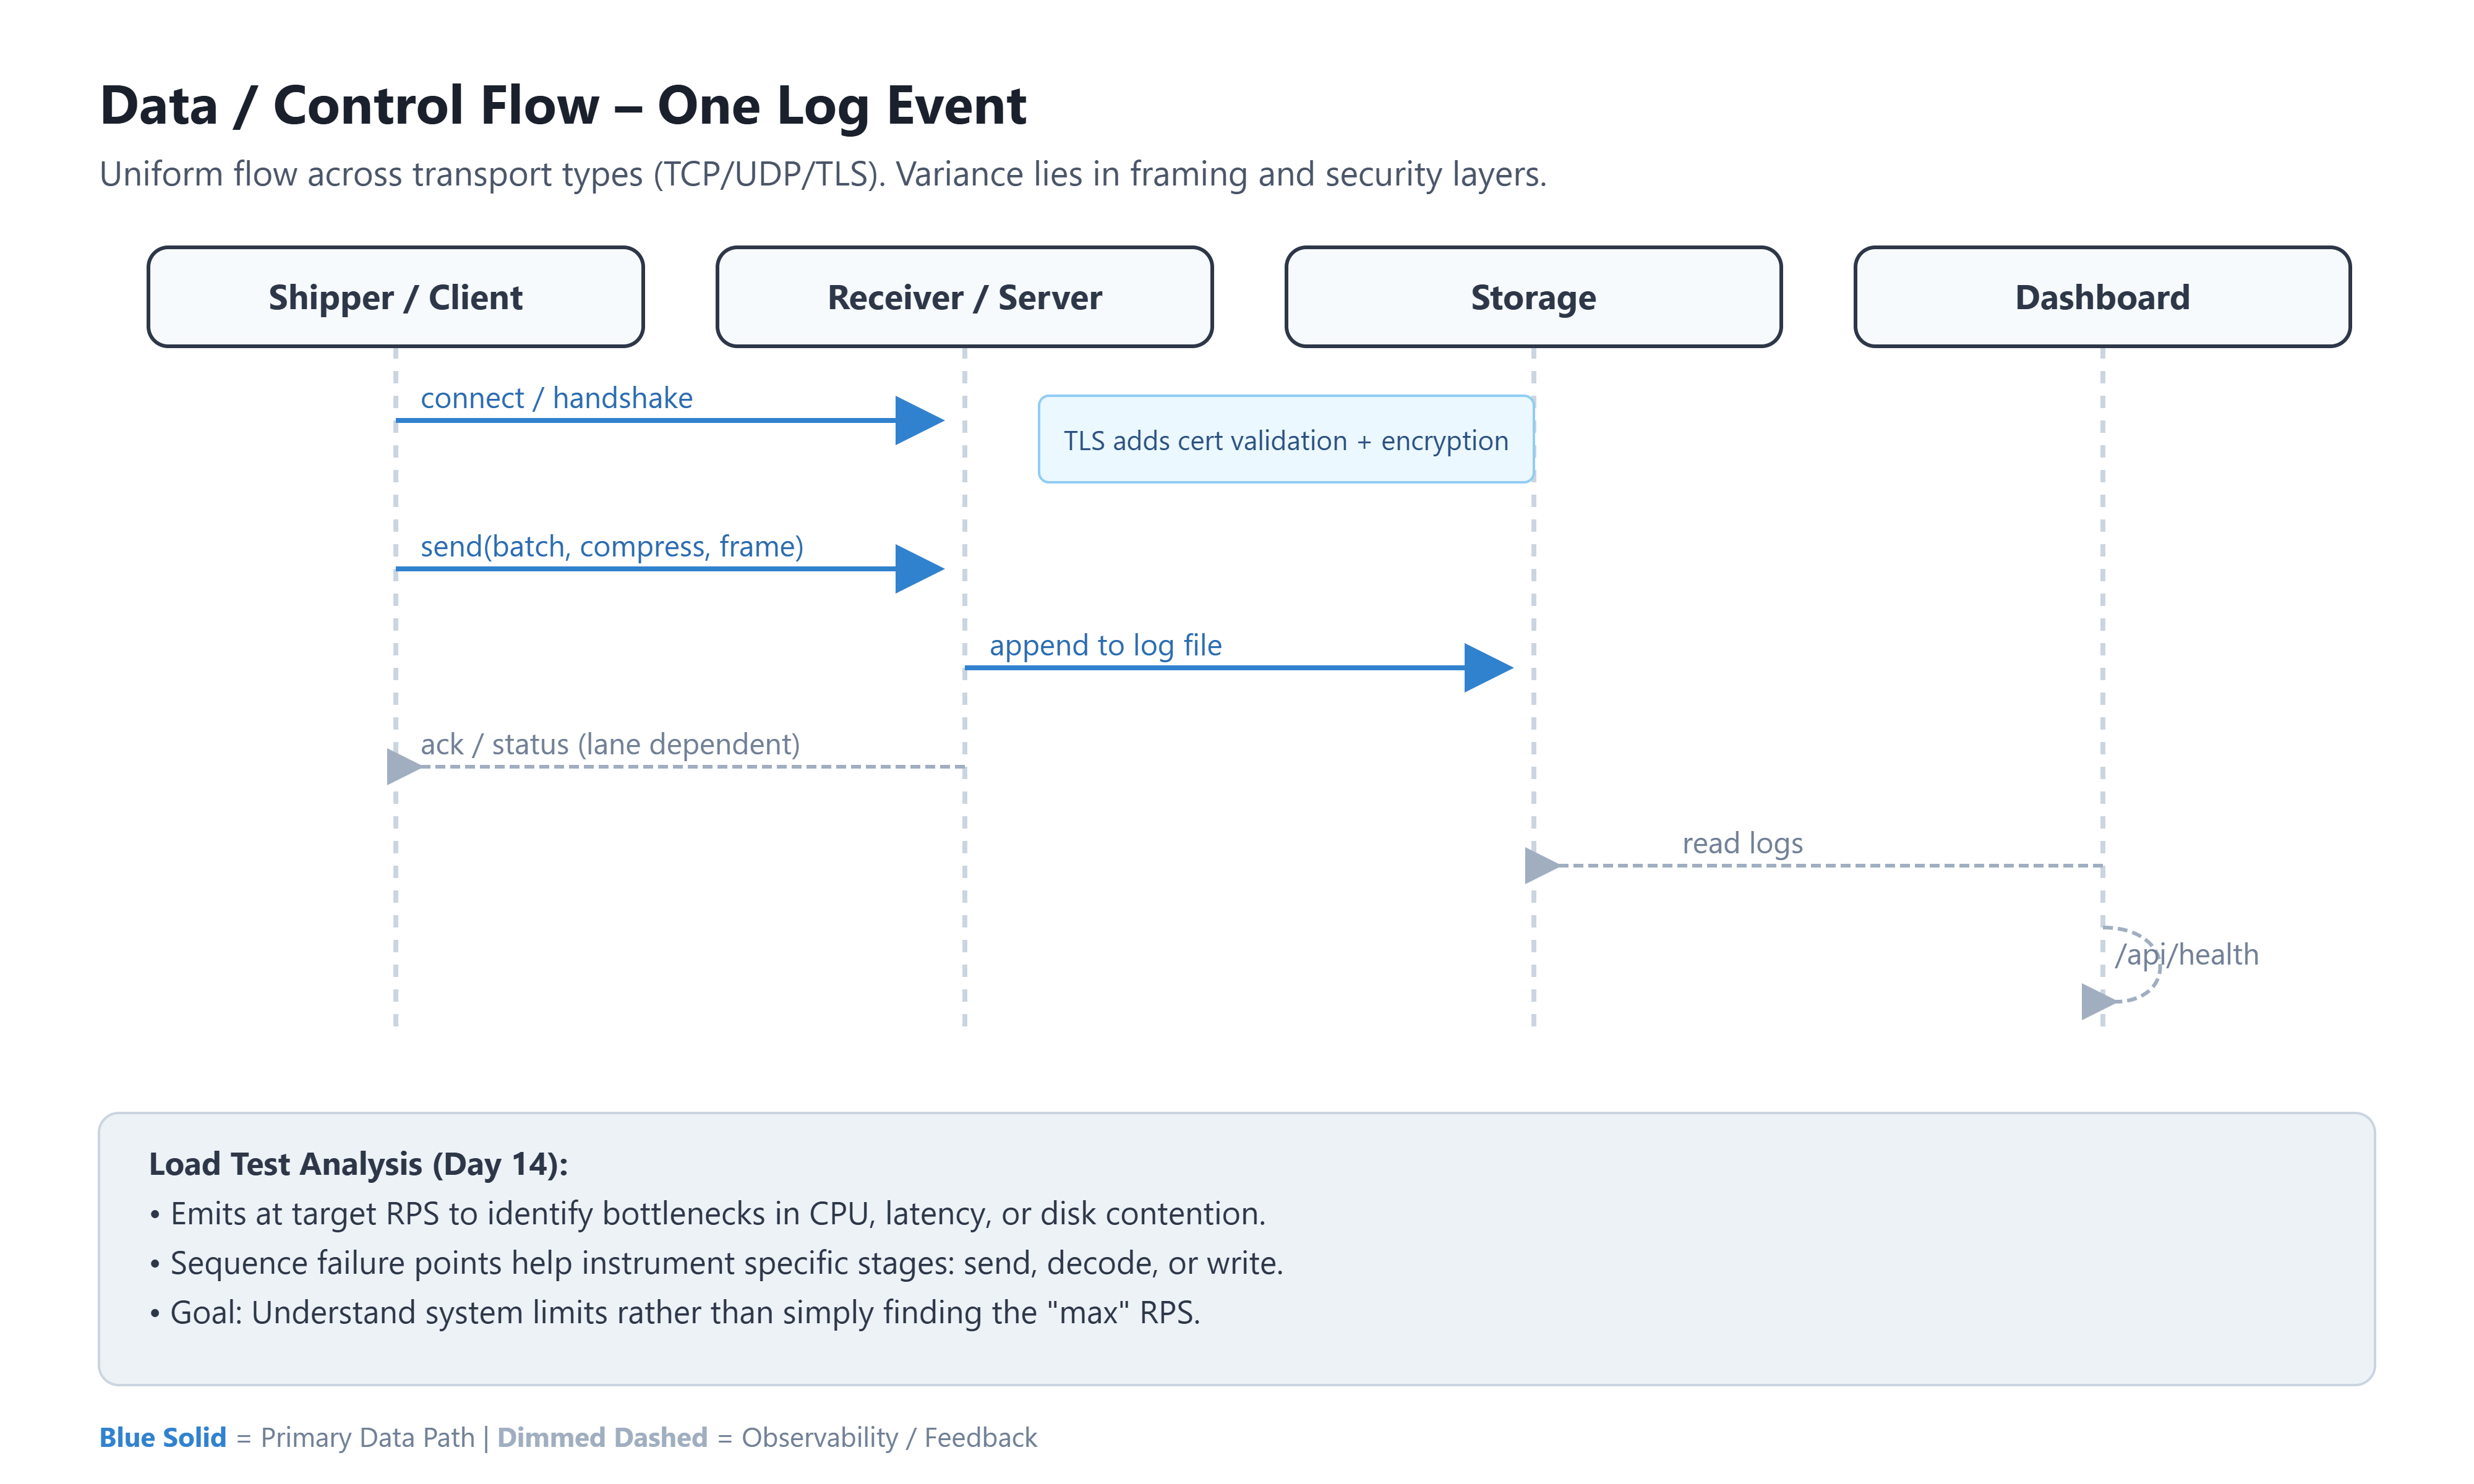
Why this shape scales: it separates concerns cleanly. Producers don’t care how storage works; receivers don’t need to know how logs were created; the dashboard only needs read access.
A simple state machine for the “shipper”
Networking code becomes manageable when you think of it as states: connect, send, retry, backoff, flush batches, etc. This repo shows multiple versions of that idea (especially around batching/compression/TLS).
Diagram 3 — Shipper state machine (placeholder)
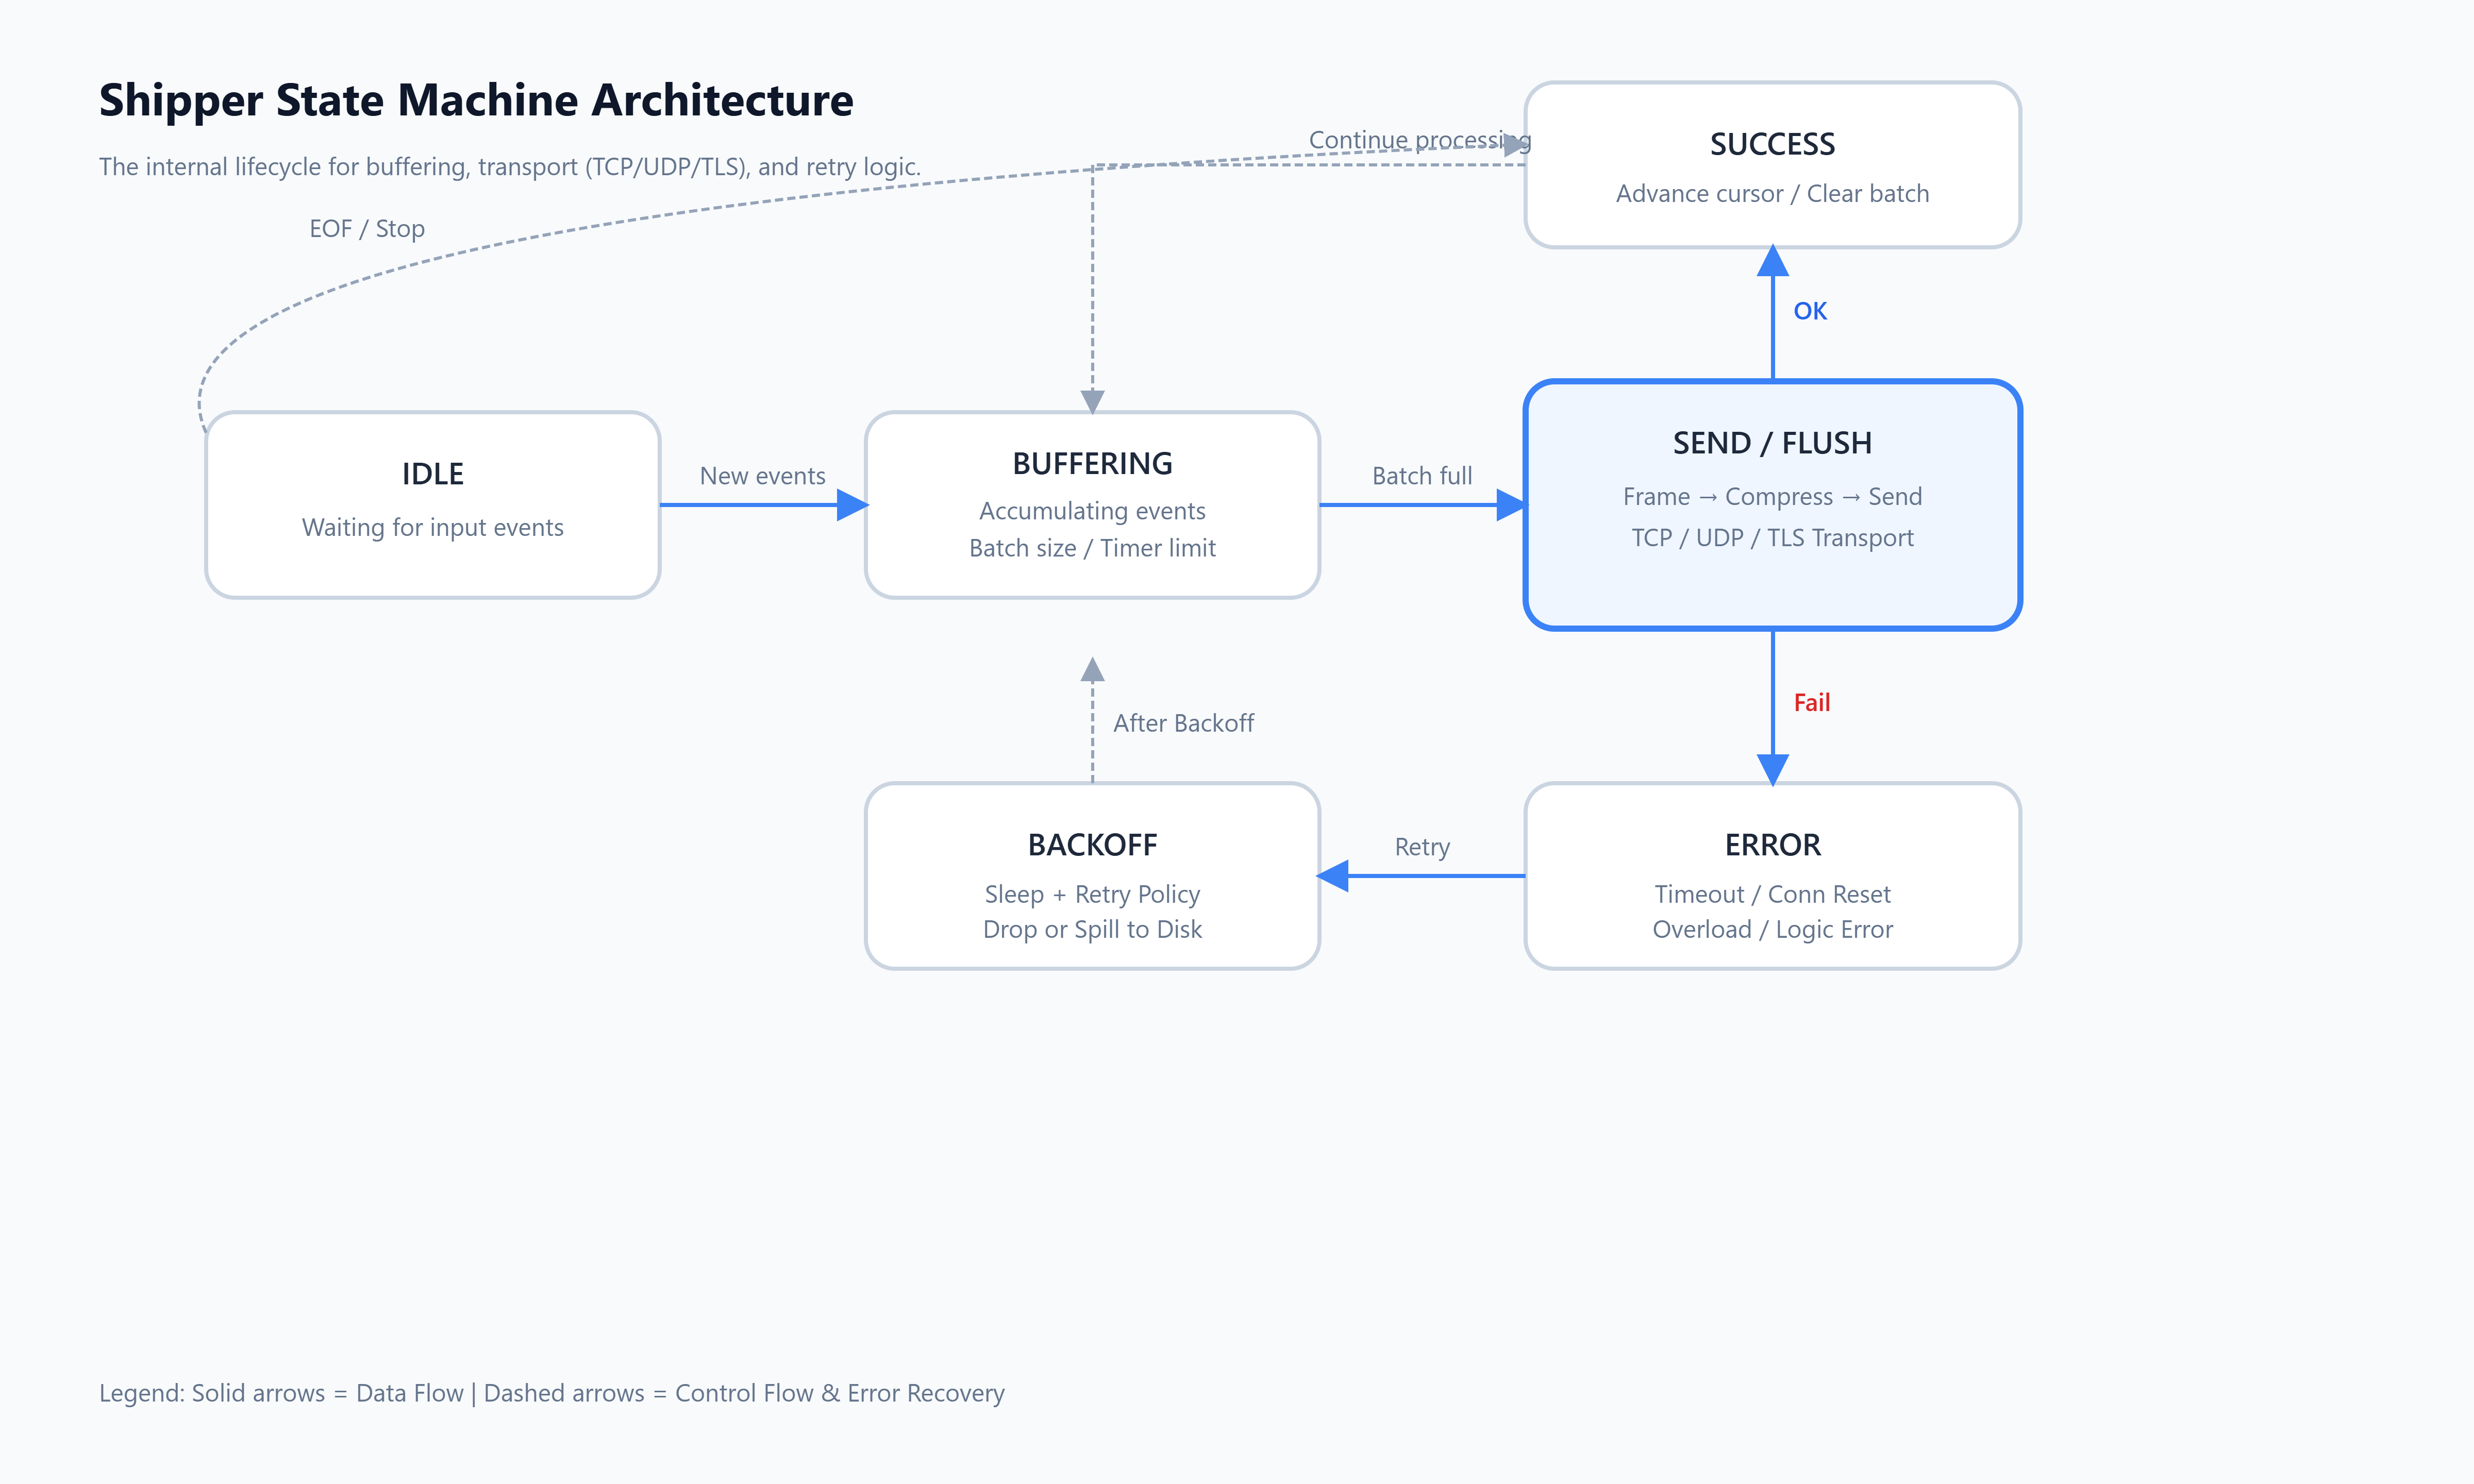
Practical takeaway: once you define the states, it’s easier to add features like “flush on interval”, “retry with jitter”, or “drop when overloaded” without turning the code into a tangle.
